This paper explores the challenges and limitations of traditional data visualization tools in the context of Big Data, emphasizing the need for modern systems that integrate insights from data management, mining, visualization, and human-computer interaction. It reviews state-of-the-art methods developed to address these challenges.
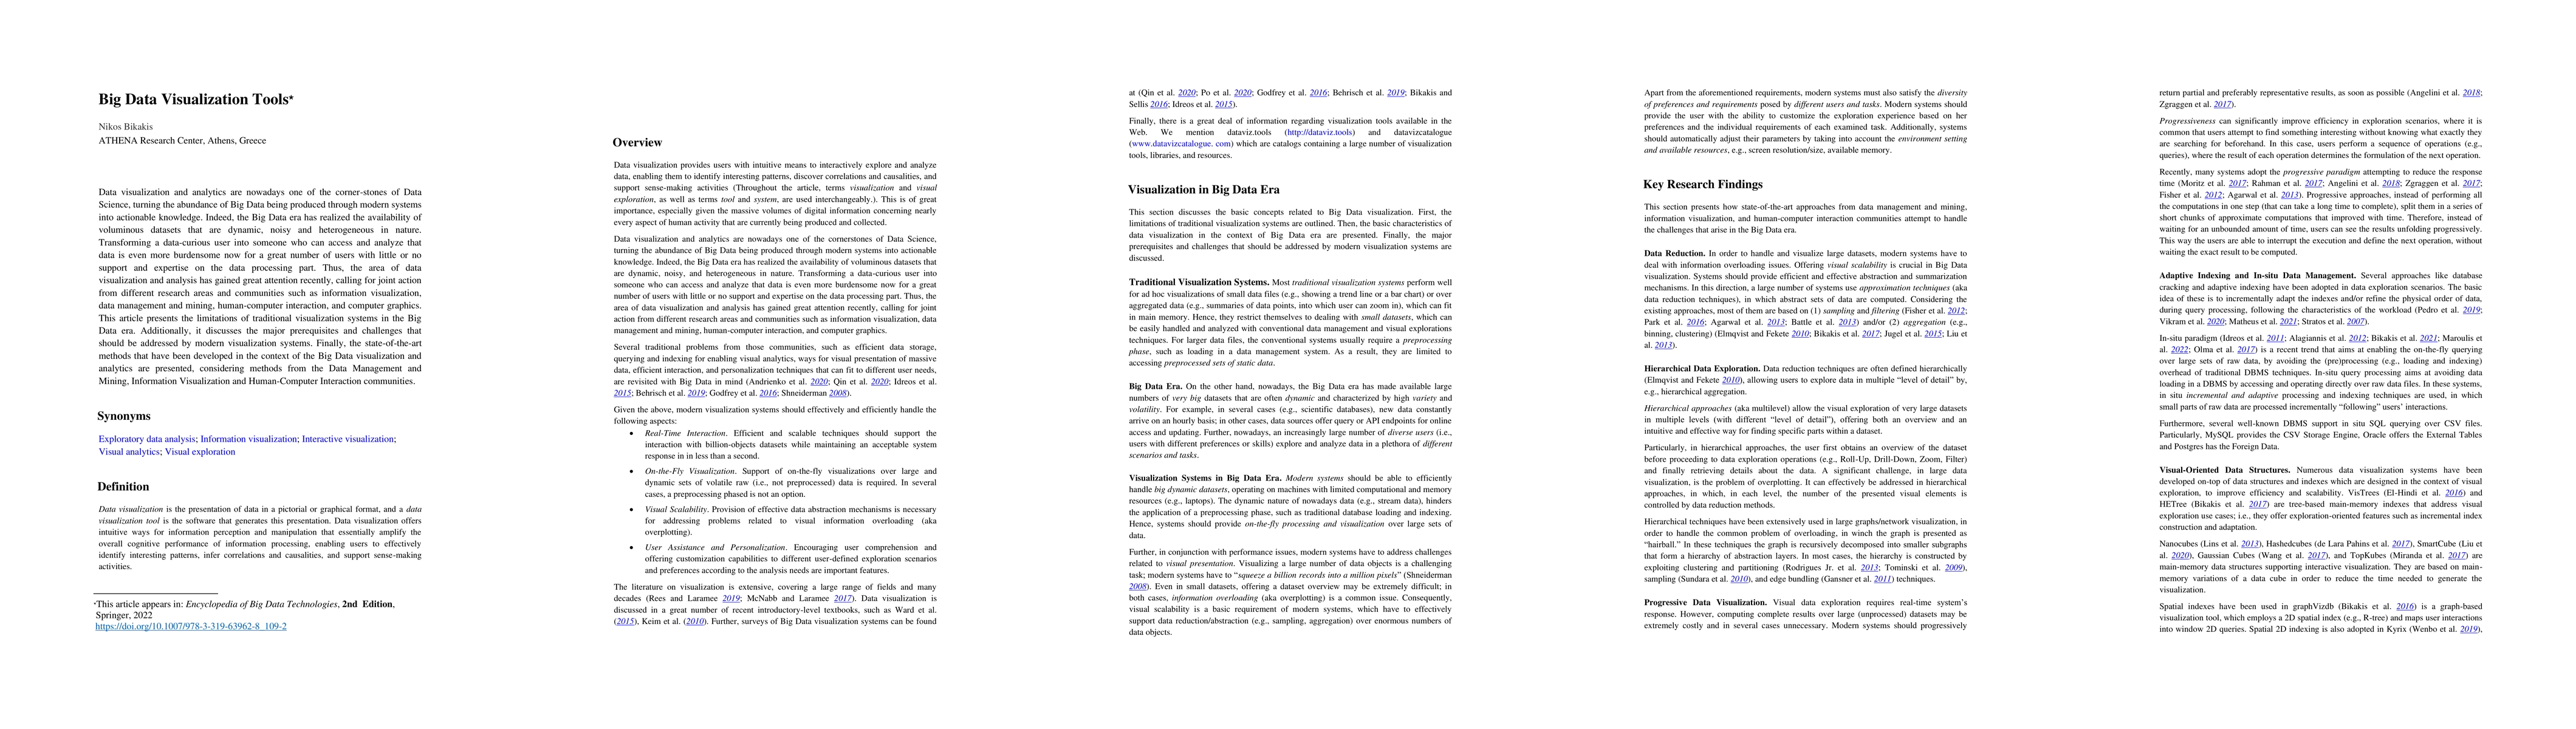
Data visualization and analytics are nowadays one of the corner-stones of Data Science, turning the abundance of Big Data being produced through modern systems into actionable knowledge. Indeed, the Big Data era has realized the availability of voluminous datasets that are dynamic, noisy and heterogeneous in nature. Transforming a data-curious user into someone who can access and analyze that data is even more burdensome now for a great number of users with little or no support and expertise on the data processing part. Thus, the area of data visualization and analysis has gained great attention recently, calling for joint action from different research areas and communities such as information visualization, data management and mining, human-computer interaction, and computer graphics. This article presents the limitations of traditional visualization systems in the Big Data era. Additionally, it discusses the major prerequisites and challenges that should be addressed by modern visualization systems. Finally, the state-of-the-art methods that have been developed in the context of the Big Data visualization and analytics are presented, considering methods from the Data Management and Mining, Information Visualization and Human-Computer Interaction communities
This graph shows how this paper is connected to other research. The current paper is shown in dark gray, papers that cite it are in green, and papers it references are in blue. You can:
• Hover over any node to see the paper title
• Click a node to view that paper's details
• Drag nodes to rearrange the graph
• Use the zoom controls (bottom right) to zoom in/out
Title | Authors | Year | Actions |
---|---|---|---|
FPCS: Feature Preserving Compensated Sampling of Streaming Time Series Data
|
Hongyan Li, Bo Yang, Yansong Chua
|
2024
|
View Paper |
Enhancing Accessibility and Navigation of Heritage Collections Through Interactive Spatiotemporal Maps
|
P. Casanova-Salas, Javier Sevilla, Inmaculada Coma, Pedro Morillo, Mar Gaitán, C. Portalés
|
2024
|
View Paper |
Adaptable Dashboards to Assist Semi Autonomous Persons in Smart Homes
|
Lucas Gonzalez, Kévin Bouchard, Julien Maître, S. Gaboury
|
2024
|
View Paper |
Seamless Decision-Making in the Big Data Era: A Modular Approach to Integrating IoT, Cloud Computing, and Data Lakes
|
Mohamed Zemmouri, Fatma Zohra Laalam, O. Kazar, Yassine Himeur, Adel Oulefki, Chahrazad Toumi, W. Mansoor, S. Attala
|
2023
|
View Paper |
Analyzing Spatio-Temporal Correlations with User-Oriented Guidance - An Interactive Visualization Approach for Demand-Oriented Limited Service Offers
|
A. Rolwes, Julian Stockemer, Klaus Böhm
|
2023
|
View Paper |
Tsdownsample: High-performance Time Series Downsampling for Scalable Visualization
|
Jeroen Van Der Donckt, Jonas Van Der Donckt, Sofie Van Hoecke
|
2023
|
View Paper |
MinMaxLTTB: Leveraging MinMax-Preselection to Scale LTTB
|
Jeroen Van Der Donckt, Jonas Van Der Donckt, Michael Rademaker, S. V. Hoecke
|
2023
|
View Paper |
Data Point Selection for Line Chart Visualization: Methodological Assessment and Evidence-Based Guidelines
|
Jonas Van Der Donckt, Jeroen Van Der Donckt, Michael Rademaker, S. V. Hoecke
|
2023
|
View Paper |
Online Student Performance System integrating Multidimensional Data Visualization and Chatbot for Primary School
|
Nor Diyana Syafiqah Mohamad Ghazali, A. Saad
|
2022
|
View Paper |
Visualizing Streaming of Ordinal Big Data
|
João Moreira, Henrique Ferreira, Daniel Gonçalves
|
2022
|
View Paper |
Visual Design as the Key Factor for Effective Environmental Analytics Dashboard
|
Z. Zainuddin, Farashazillah Yahya, Ahmad Fareez Yahya
|
2022
|
View Paper |
Real-Time Interactive Visualization and Analysis of Neurotransmitter Data
|
Anne Thomas Homescu, T. Murray
|
2022
|
View Paper |
Using Chained Views and Follow-Up Queries to Assist the Visual Exploration of the Web of Big Linked Data
|
Aline Menin, Minh Nhat Do, Carla Freitas, O. Corby, Catherine Faron-Zucker, A. Giboin, M. Winckler
|
2022
|
View Paper |
Plotly-Resampler: Effective Visual Analytics for Large Time Series
|
Jonas Van Der Donckt, Jeroen Van Der Donckt, Emiel Deprost, S. V. Hoecke
|
2022
|
View Paper |
Big Data Analytics: A Survey
|
Wasnaa Kadhim Jawad, Abbas M. Al-Bakry
|
2022
|
View Paper |
The effect of population and tourism factors on Covid‐19 cases in Italy: Visual data analysis and forecasting approach
|
S. Uguz, Mete Yaganoglu, B. Özyer, Gülşah Tümüklü Özyer, Gül Tokdemir
|
2021
|
View Paper |
RawVis: A System for Efficient In-situ Visual Analytics
|
Stavros Maroulis, Nikos Bikakis, George Papastefanatos, Panos Vassiliadis, Y. Vassiliou
|
2021
|
View Paper |
ExpanDrogram: Dynamic Visualization of Big Data Segmentation over Time
|
Anna Khalemsky, R. Gelbard
|
2021
|
View Paper |
GreedyBigVis – A greedy approach for preparing large datasets to multidimensional visualization
|
Moustafa Sadek Kahil, Abdelkrim Bouramoul, M. Derdour
|
2021
|
View Paper |
Fostering Computational Thinking Through Data Visualization and Design on Secondary School Students
|
G. A. Özkök
|
2021
|
View Paper |
Empirical evaluation of Linked Data visualization tools
|
F. Desimoni, Laura Po
|
2020
|
View Paper |
Experts' perspective for selecting learning analytics visualizations
|
Dafinka Miteva, E. Stefanova
|
2020
|
View Paper |
Interactive Exploration of Large-Scale UI Datasets with Design Maps
|
Luis A. Leiva, Asutosh Hota, A. Oulasvirta
|
2020
|
View Paper |
Data visualization in internet of things: tools, methodologies, and challenges
|
Antonis I Protopsaltis, P. Sarigiannidis, Dimitrios G. Margounakis, Anastasios Lytos
|
2020
|
View Paper |
An exploratory teaching program in big data analysis for undergraduate students
|
S. Eken
|
2020
|
View Paper |
Enhancing the Interactive Visualisation of a Data Preparation Tool from in-Memory Fitting to Big Data Sets
|
Gorka Epelde, Roberto Álvarez, A. Beristain, Mónica Arrúe, I. Arangoa, Debbie Rankin
|
2020
|
View Paper |
Design Method of Front-end Componentized Architecture for Big Data Visualization Large-screen
|
E. Haihong, Tianyu Zhang, Meina Song
|
2020
|
View Paper |
Open our visualization eyes, individualization: On Albrecht Dürer’s 1515 wood cut celestial charts
|
Brian J. d'Auriol
|
2020
|
View Paper |
Linked Data Visualization: Techniques, Tools, and Big Data
|
Laura Po, Nikos Bikakis, F. Desimoni, George Papastefanatos
|
2020
|
View Paper |
Requirements of Data Visualisation Tools to Analyse Big Data: A Structured Literature Review
|
Joy Lowe, M. Matthee
|
2020
|
View Paper |
Making data visualization more efficient and effective: a survey
|
Xuedi Qin, Yuyu Luo, N. Tang, Guoliang Li
|
2019
|
View Paper |
BIBLIOGRAPHY
|
2019
|
View Paper | |
Location-Based Augmented Reality In-situ Visualization Applied for Agricultural Fieldwork Navigation
|
Mengya Zheng, A. Campbell
|
2019
|
View Paper |
Big Data and Interactive Visualization: Overview on Challenges, Techniques and Tools
|
Moustafa Sadek Kahil, Abdelkrim Bouramoul, M. Derdour
|
2019
|
View Paper |
Hillview: A trillion-cell spreadsheet for big data
|
M. Budiu, Parikshit Gopalan, L. Suresh, Udi Wieder, Han Kruiger, M. Aguilera
|
2019
|
View Paper |
Big Data Analysis and Services: Visualization on Smart Data to Support Healthcare Analytics
|
C. Leung, Yibin Zhang, Calvin S. H. Hoi, Joglas Souza, Bryan H. Wodi
|
2019
|
View Paper |
Practical Implications On How Established Companies Innovate With Startups
|
A. Back, Tina Werro, Lukas Peter
|
2019
|
View Paper |
Application of Big Data in Libraries
|
Washington Kamupunga, Chunting Yang
|
2019
|
View Paper |
Enhancing Big Data Warehousing for Efficient, Integrated and Advanced Analytics - Visionary Paper
|
M. Y. Santos, Carlos A. Costa, João Galvão, Carina Andrade, Ó. Pastor, A. Marcén
|
2019
|
View Paper |
Towards a New Architecture for Data Multilevels Interactive Visualization in Big Data Domains
|
Moustafa Sadek Kahil, Abdelkrim Bouramoul, M. Derdour
|
2019
|
View Paper |
(The) Digital
|
Zara Dinnen
|
2019
|
View Paper |
Visualization of educational data mined from the moodle e-learning platform
|
Elias Misailidis, A. Charitopoulos, M. Rangoussi
|
2018
|
View Paper |
Big Data Technology for Scientific Applications
|
G. Suciu, Muneeb Anwar, I. Rogojanu, A. Pasat, Alina Stanoiu
|
2018
|
View Paper |
Plant data visualisation using network graphs
|
Afrina Adlyna Mohamad-Matrol, Siow-Wee Chang, Arpah Abu
|
2018
|
View Paper |
Exploratory Study for Data Visualization in Internet of Things
|
Mohamad Yuzrie Khalid, P. Then, V. Raman
|
2018
|
View Paper |
Improve E-Learning Ecosystem with Big Data in Higher Education
|
N. Djajasinga, Destiana Utarindasari, Rizky Muslim, Fadhillah Fachri
|
2023
|
View Paper |
EMPOWERING WOMEN IN PLACE
|
M. Dolores, Pitarch Garrido, Félix Fajardo Magraner, María Dolores Pitarch Garrido, Félix Fajardo Magraner, Dolores Pitarch, Félix Fajardo
|
2023
|
View Paper |
Using UX design principles for comprehensive data visualisation
|
Umar Ali, Rabi Sulaiman
|
2023
|
View Paper |
HealthHue: Developing an Artistic Visualization of Health data for Individuals and Informal Caregivers
|
2023
|
View Paper | |
VisualFacts: A Platform for In-Situ Visual Exploration and Real-Time Entity Resolution
|
George Papastefanatos, G. Alexiou, Nikos Bikakis, Stavros Maroulis, Vassilis Stamatopoulos
|
2022
|
View Paper |
In-situ visual exploration over big raw data
|
Nikos Bikakis, Stavros Maroulis, George Papastefanatos, Panos Vassiliadis
|
2021
|
View Paper |
Business Intelligence (BI) Application in Open-source Content Management System (CMS): A Review
|
Harnisa Azrin Hakimi, Sharifalillah Nordin
|
2021
|
View Paper |
An Automated Visualization Feature-Based Analysis Tool
|
R. A. Kadir, S. Jusoh, Joshua Faburada
|
2021
|
View Paper |
Actor’s knowledge massive identification in the learning management system
|
Y. B. Touimi, Abdelladim Hadioui, Nourredine El Faddouli, S. Bennani
|
2021
|
View Paper |
Knowledge Extraction and Data Visualization: A Proposed Framework for Secure Decision Making using Data Mining
|
H. Alshareef, Ahmed Majrashi, M. Helal, Muhammad Tahir
|
2021
|
View Paper |
Data Visualization Tools and Data Modelling
|
P. Mahalle, G. Shinde, P. Pise, J. Deshmukh
|
2021
|
View Paper |
The Digital Shipyard Opportunities and Challenges
|
J. Spoehr, Ryan Jang, Kosta Manning, Arvind Rajagopalan, Cecilia Moretti, A. Hordacre, Sara Howard, P. Yaron, L. Worrall
|
2021
|
View Paper |
An Analytical Reasoning Framework for Visual Analytics Representation
|
Suraya Ya’acob, S. Yusof, D. Wong, Norziha Megat Zainuddin
|
2021
|
View Paper |
Pre-model Interpretability and Explainability
|
Uday Kamath, John Chih Liu
|
2021
|
View Paper |
Knowledge Model for Disaster Dataset Navigation
|
Yun-Young Hwang, J. Yuk, Sumi Shin
|
2021
|
View Paper |
Using Data Analytics To Extract Knowledge From Middle-Of-Life Product Data
|
F. A. Eddahab, I. Horváth
|
2020
|
View Paper |
Comparative Analysis of Tools for Big Data Visualization and Challenges
|
G. Zion, B. Tripathy
|
2020
|
View Paper |
A Comparative Study of State-of-The-Art Linked Data Visualization Tools
|
F. Desimoni, Nikos Bikakis, Laura Po, George Papastefanatos
|
2020
|
View Paper |
Core Algorithms of Sparse 3D Mipmapping Visualization Technology
|
S. Orlov, A. Kuzin, A. Zhuravlev
|
2020
|
View Paper |
Data analysis through graph decomposition
|
Marie Ely Piceno
|
2020
|
View Paper |
Business Information Systems Workshops: BIS 2020 International Workshops, Colorado Springs, CO, USA, June 8–10, 2020, Revised Selected Papers
|
W. Abramowicz, Gary Klein
|
2020
|
View Paper |
RDF Visualizer: A Tool for Displaying, Browsing and Exploring High Density RDF Data
|
K. Petrakis, N. Minadakis, Korina Doerr, M. Theodoridou, M. Doerr
|
2019
|
View Paper |
Preprocessing unbounded data for use in real time visualization : Building a visualization data cube of unbounded data
|
Isabelle Hallman
|
2019
|
View Paper |
High-level Visualization Over Big Linked Data
|
Laura Po
|
2018
|
View Paper |
Improving the Order-Picking Process in the Case Company
|
B. Gao
|
2018
|
View Paper |
Dictionaries as collections of lexical data stories: an alternative post-editing model for historical corpus lexicography
|
Ligeia Lugli
|
View Paper | |
Design and Implementation of Big Data Visualization for Student Housing Analysis
|
Khairul Anwar Sedek, Nurfarah Fatini, Mohd Mohd Maulus, Nizam Osman, Norjah Othman
|
View Paper |
Minyar Sassi Hidri, Rania Mkhinini Gahar, Olfa Arfaoui
Published: 2024-04-22
KJ Hepworth
Published: 2024-12-03
Comments (0)