Bike Flow Prediction with Multi-Graph Convolutional Networks
Publication
Metrics
AI Quick Summary
This paper proposes a multi-graph convolutional neural network model to enhance station-level bike flow prediction in bike sharing systems. The model constructs multiple inter-station graphs to capture diverse relationships and fuses them for accurate predictions, outperforming existing methods by reducing prediction error by 25.1% in New York City and 17.0% in Chicago.
Paper Preview
Abstract
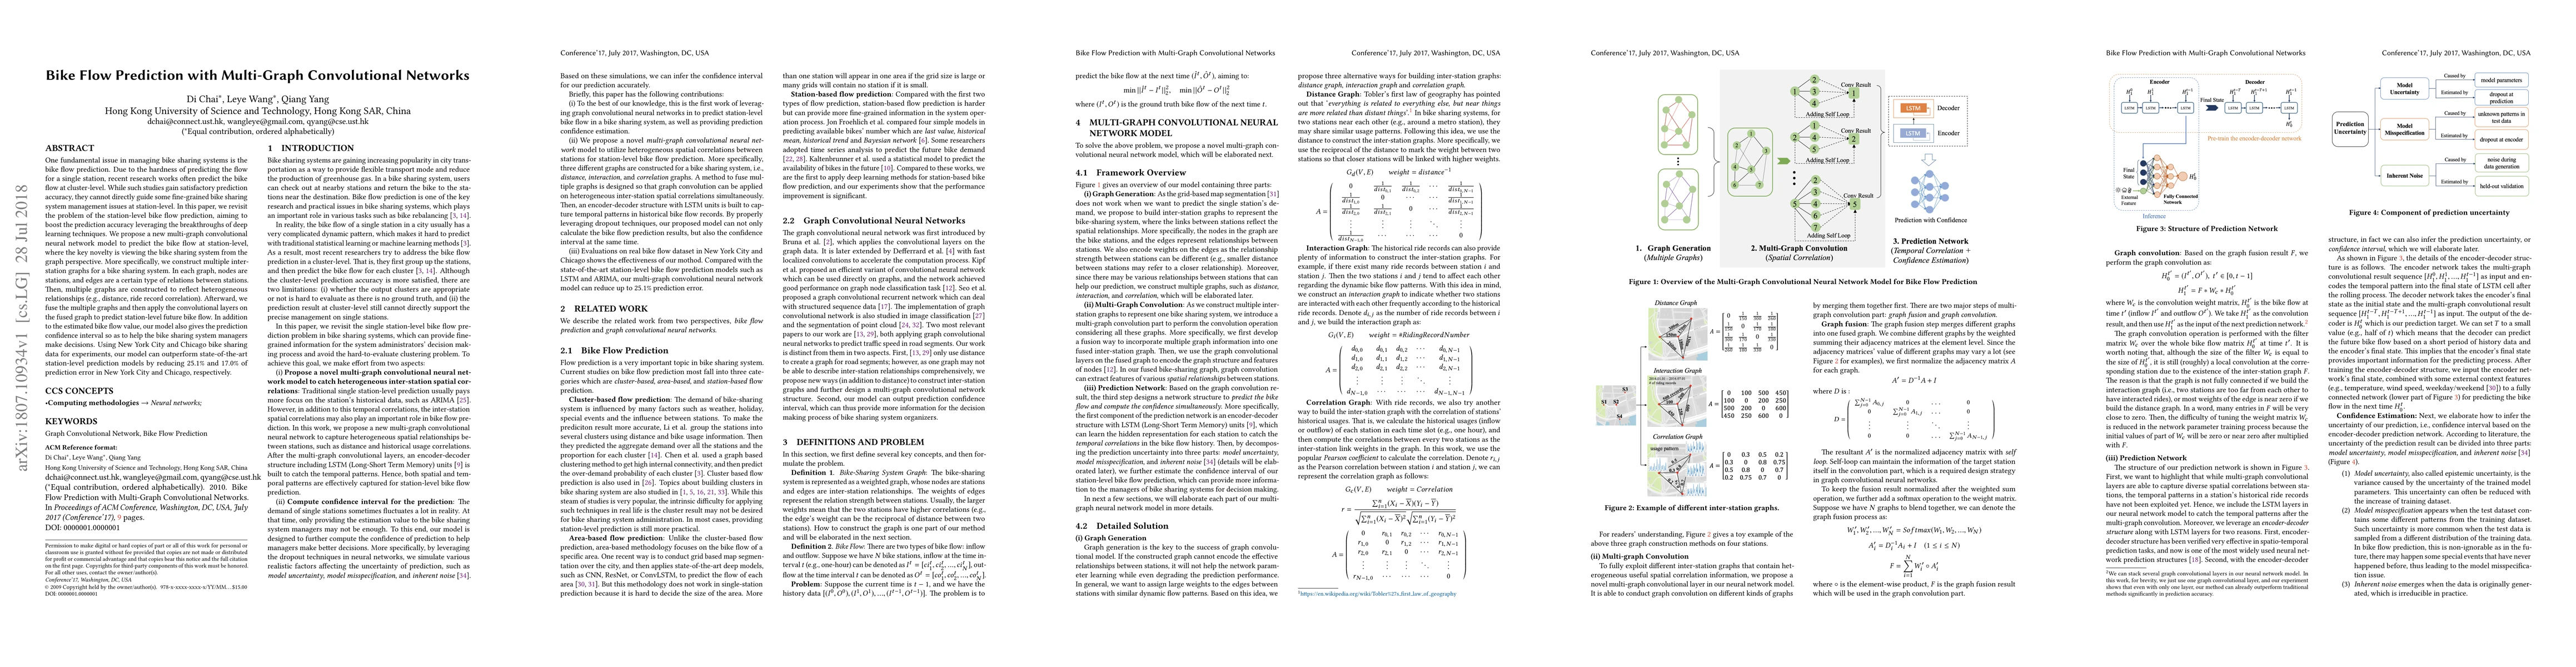
One fundamental issue in managing bike sharing systems is the bike flow prediction. Due to the hardness of predicting the flow for a single station, recent research works often predict the bike flow at cluster-level. While such studies gain satisfactory prediction accuracy, they cannot directly guide some fine-grained bike sharing system management issues at station-level. In this paper, we revisit the problem of the station-level bike flow prediction, aiming to boost the prediction accuracy leveraging the breakthroughs of deep learning techniques. We propose a new multi-graph convolutional neural network model to predict the bike flow at station-level, where the key novelty is viewing the bike sharing system from the graph perspective. More specifically, we construct multiple inter-station graphs for a bike sharing system. In each graph, nodes are stations, and edges are a certain type of relations between stations. Then, multiple graphs are constructed to reflect heterogeneous relationships (e.g., distance, ride record correlation). Afterward, we fuse the multiple graphs and then apply the convolutional layers on the fused graph to predict station-level future bike flow. In addition to the estimated bike flow value, our model also gives the prediction confidence interval so as to help the bike sharing system managers make decisions. Using New York City and Chicago bike sharing data for experiments, our model can outperform state-of-the-art station-level prediction models by reducing 25.1% and 17.0% of prediction error in New York City and Chicago, respectively.
AI Key Findings
Get AI-generated insights about this paper's methodology, results, significance, and more — seven facets brought into focus.
Impact
Paper Details
PDF Preview
Key Terms
Citation Network
Current paper (gray), citations (green), references (blue)
Display is limited for performance on very large graphs.
Discussion 0