Publication
Metrics
AI Quick Summary
This paper introduces a binary de Bruijn process for modeling binary time series data, utilizing de Bruijn Graphs to account for temporal correlations beyond single-step Bernoulli processes. The model captures dependencies over longer sequences and includes an analysis of run lengths for clustering properties, with applications demonstrated in precipitation data and the Oxford and Cambridge boat race.
Paper Preview
Abstract
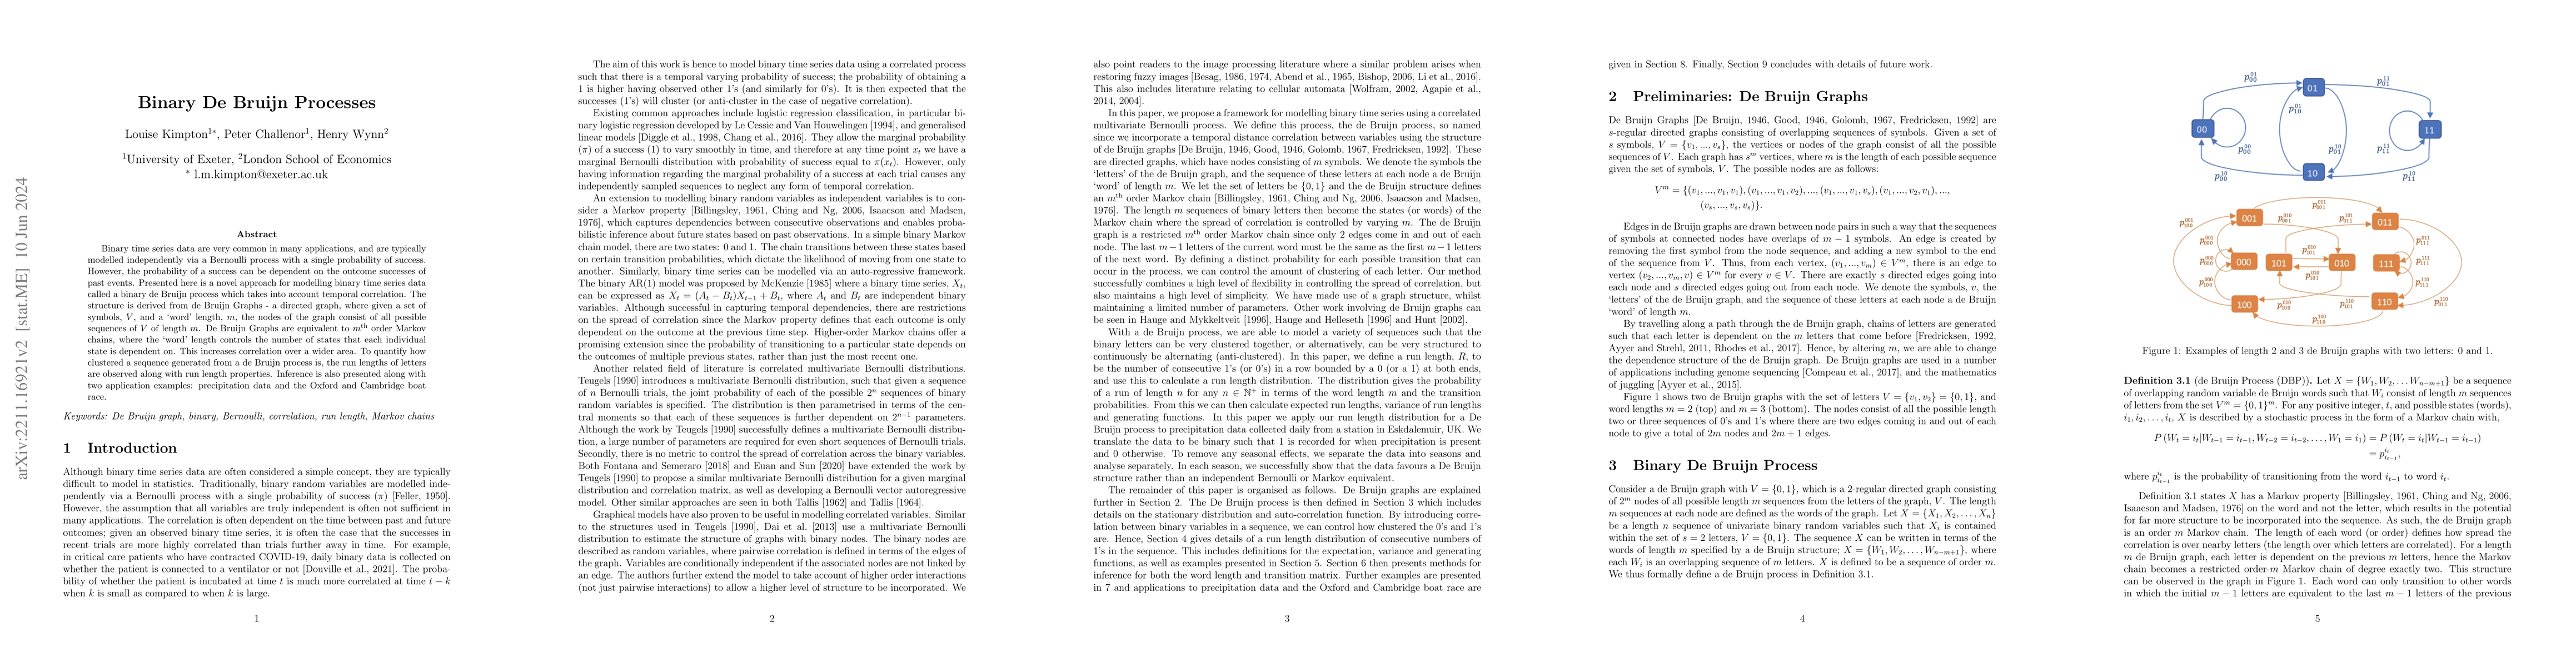
Binary time series data are very common in many applications, and are typically modelled independently via a Bernoulli process with a single probability of success. However, the probability of a success can be dependent on the outcome successes of past events. Presented here is a novel approach for modelling binary time series data called a binary de Bruijn process which takes into account temporal correlation. The structure is derived from de Bruijn Graphs - a directed graph, where given a set of symbols, V, and a 'word' length, m, the nodes of the graph consist of all possible sequences of V of length m. De Bruijn Graphs are equivalent to mth order Markov chains, where the 'word' length controls the number of states that each individual state is dependent on. This increases correlation over a wider area. To quantify how clustered a sequence generated from a de Bruijn process is, the run lengths of letters are observed along with run length properties. Inference is also presented along with two application examples: precipitation data and the Oxford and Cambridge boat race.
AI Key Findings
Get AI-generated insights about this paper's methodology, results, significance, and more — seven facets brought into focus.
Impact
Paper Details
Authors
PDF Preview
Key Terms
Citation Network
Current paper (gray), citations (green), references (blue)
Display is limited for performance on very large graphs.
Discussion 0