Publication
Metrics
AI Quick Summary
This study analyzes Bitcoin's price fluctuations from 2010 to 2021, identifying at least ten significant price spikes similar to the 2017 episode, each lasting 50-100 days. The researchers approximate BTC price evolution using a Fibonacci sequence-like function and find it to be more illiquid compared to equities, currencies, and gold.
Paper Preview
Abstract
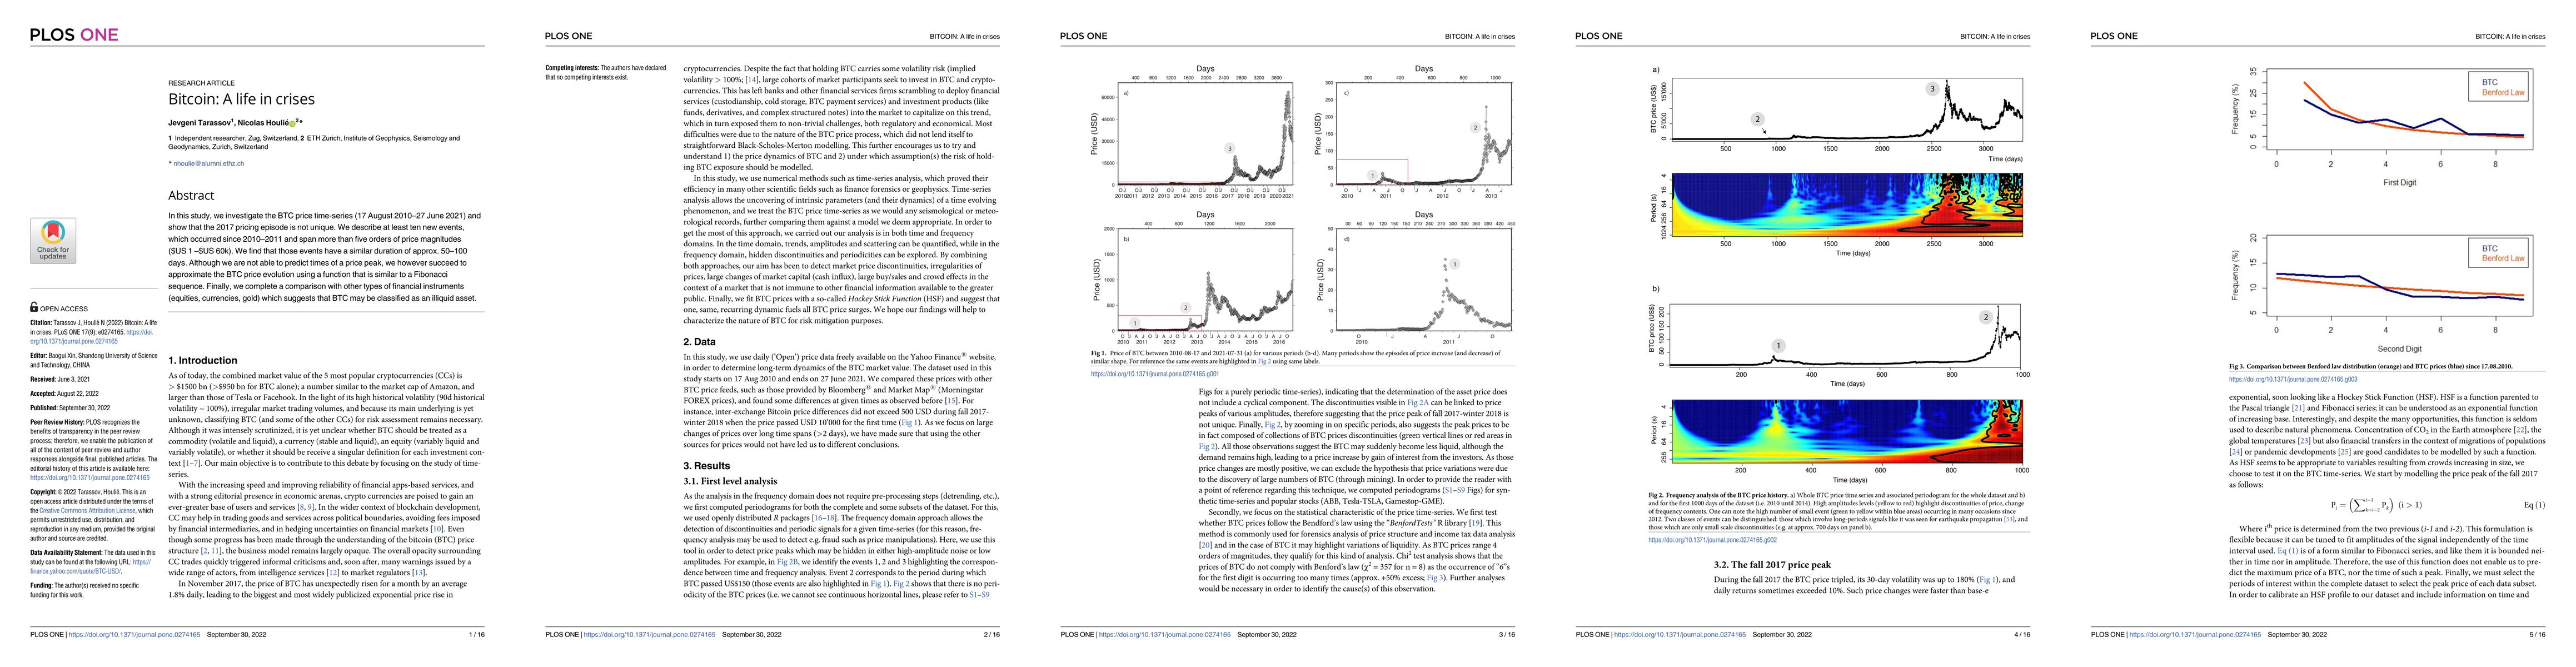
In this study, we investigate the BTC price time-series (17 August 2010-27 June 2021) and show that the 2017 pricing episode is not unique. We describe at least ten new events, which occurred since 2010-2011 and span more than five orders of price magnitudes ($US 1-$US 60k). We find that those events have a similar duration of approx. 50-100 days. Although we are not able to predict times of a price peak, we however succeed to approximate the BTC price evolution using a function that is similar to a Fibonacci sequence. Finally, we complete a comparison with other types of financial instruments (equities, currencies, gold) which suggests that BTC may be classified as an illiquid asset.
AI Key Findings
Get AI-generated insights about this paper's methodology, results, significance, and more — seven facets brought into focus.
Impact
Paper Details
Authors
PDF Preview
Key Terms
Citation Network
Current paper (gray), citations (green), references (blue)
Display is limited for performance on very large graphs.
Discussion 0