Publication
Metrics
AI Quick Summary
This paper models Bitcoin risk using blockchain transaction graphs to analyze the flow of information and its impact on cryptocurrency investment risk. It identifies specific sub-graphs, termed "chainlets," that predict Bitcoin price movements and volatility, highlighting those associated with extreme losses.
Paper Preview
Abstract
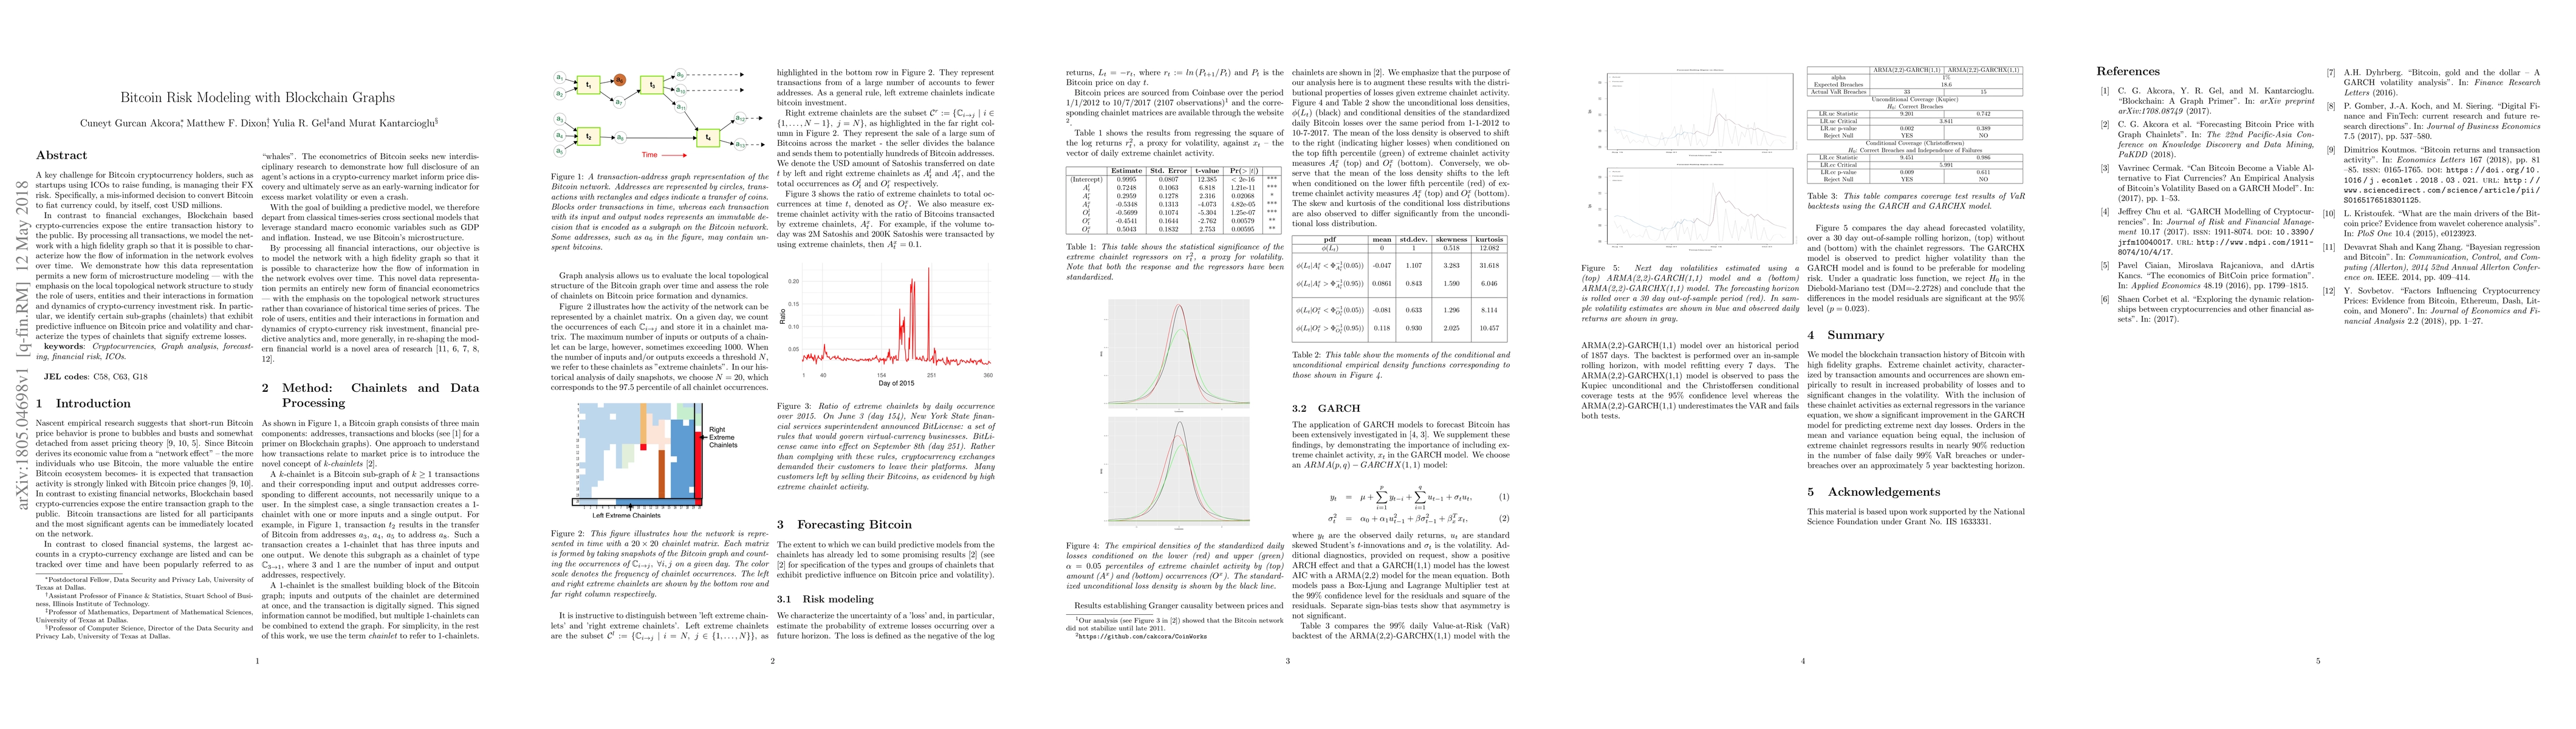
A key challenge for Bitcoin cryptocurrency holders, such as startups using ICOs to raise funding, is managing their FX risk. Specifically, a misinformed decision to convert Bitcoin to fiat currency could, by itself, cost USD millions. In contrast to financial exchanges, Blockchain based crypto-currencies expose the entire transaction history to the public. By processing all transactions, we model the network with a high fidelity graph so that it is possible to characterize how the flow of information in the network evolves over time. We demonstrate how this data representation permits a new form of microstructure modeling - with the emphasis on the topological network structures to study the role of users, entities and their interactions in formation and dynamics of crypto-currency investment risk. In particular, we identify certain sub-graphs ('chainlets') that exhibit predictive influence on Bitcoin price and volatility, and characterize the types of chainlets that signify extreme losses.
AI Key Findings
Get AI-generated insights about this paper's methodology, results, significance, and more — seven facets brought into focus.
Impact
Paper Details
PDF Preview
Key Terms
Citation Network
Current paper (gray), citations (green), references (blue)
Display is limited for performance on very large graphs.
Discussion 0