Publication
Metrics
AI Quick Summary
This paper investigates why CO first overtone emission is detected in only about 25% of massive young stellar objects (MYSOs). It hypothesizes that detectable CO emission correlates with moderate mass accretion rates, finding that high or low accretion rates result in lower CO emission due to dust sublimation effects. The study concludes that the variability in detection rates is likely due to the range of accretion rates among MYSOs.
Paper Preview
Abstract
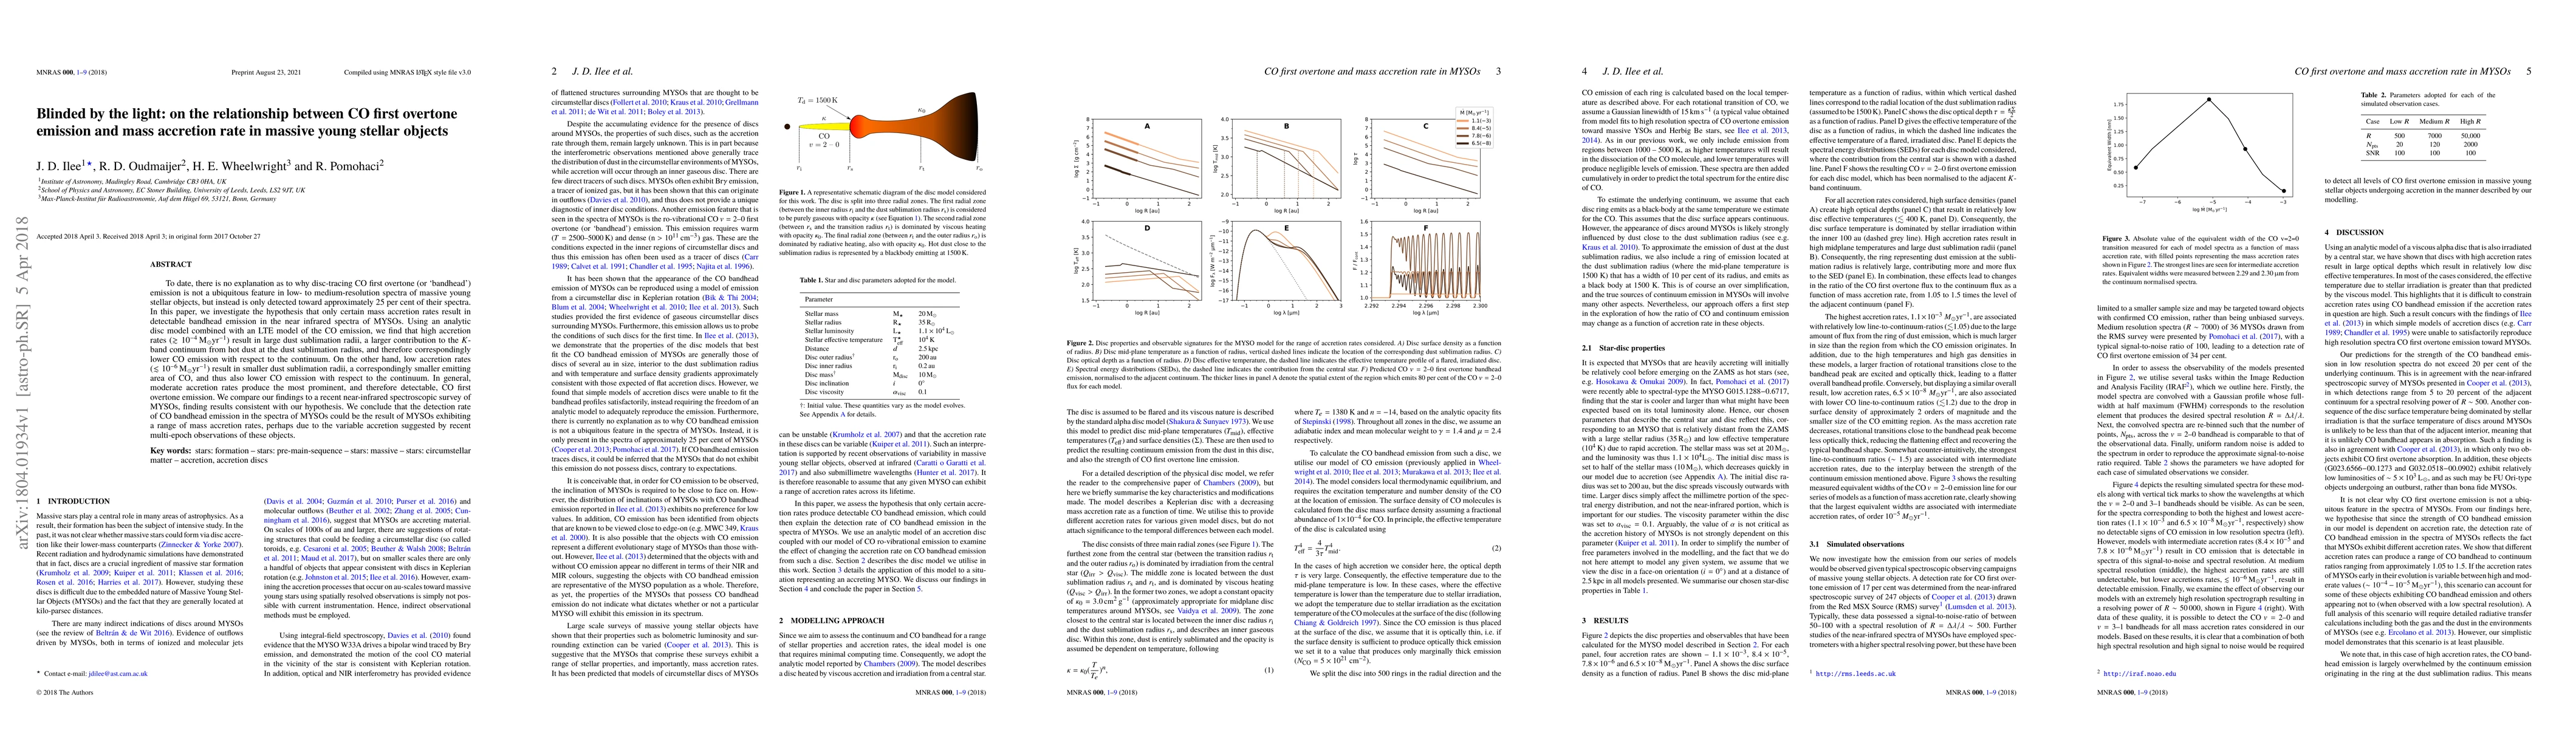
To date, there is no explanation as to why disc-tracing CO first overtone (or `bandhead') emission is not a ubiquitous feature in low- to medium-resolution spectra of massive young stellar objects, but instead is only detected toward approximately 25 per cent of their spectra. In this paper, we investigate the hypothesis that only certain mass accretion rates result in detectable bandhead emission in the near infrared spectra of MYSOs. Using an analytic disc model combined with an LTE model of the CO emission, we find that high accretion rates ($\gtrsim 10^{-4}\,{\rm M}_{\odot}{\mathrm{yr}}^{-1}$) result in large dust sublimation radii, a larger contribution to the $K$-band continuum from hot dust at the dust sublimation radius, and therefore correspondingly lower CO emission with respect to the continuum. On the other hand, low accretion rates ($\lesssim10^{-6}\,{\rm M}_{\odot}{\mathrm{yr}}^{-1}$) result in smaller dust sublimation radii, a correspondingly smaller emitting area of CO, and thus also lower CO emission with respect to the continuum. In general, moderate accretion rates produce the most prominent, and therefore detectable, CO first overtone emission. We compare our findings to a recent near-infrared spectroscopic survey of MYSOs, finding results consistent with our hypothesis. We conclude that the detection rate of CO bandhead emission in the spectra of MYSOs could be the result of MYSOs exhibiting a range of mass accretion rates, perhaps due to the variable accretion suggested by recent multi-epoch observations of these objects.
AI Key Findings
Get AI-generated insights about this paper's methodology, results, significance, and more — seven facets brought into focus.
Impact
Paper Details
PDF Preview
Key Terms
Citation Network
Current paper (gray), citations (green), references (blue)
Display is limited for performance on very large graphs.
Discussion 0