Board-level Code-Modulated Embedded Test and Calibration of an X-band Phased-Array Transceiver
Publication
Metrics
AI Quick Summary
This paper introduces code-modulated embedded test (CoMET) for built-in test and calibration of X-band phased-array transceivers, achieving accurate gain and phase measurements at 6 GHz and improving calibration results significantly.
Paper Preview
Abstract
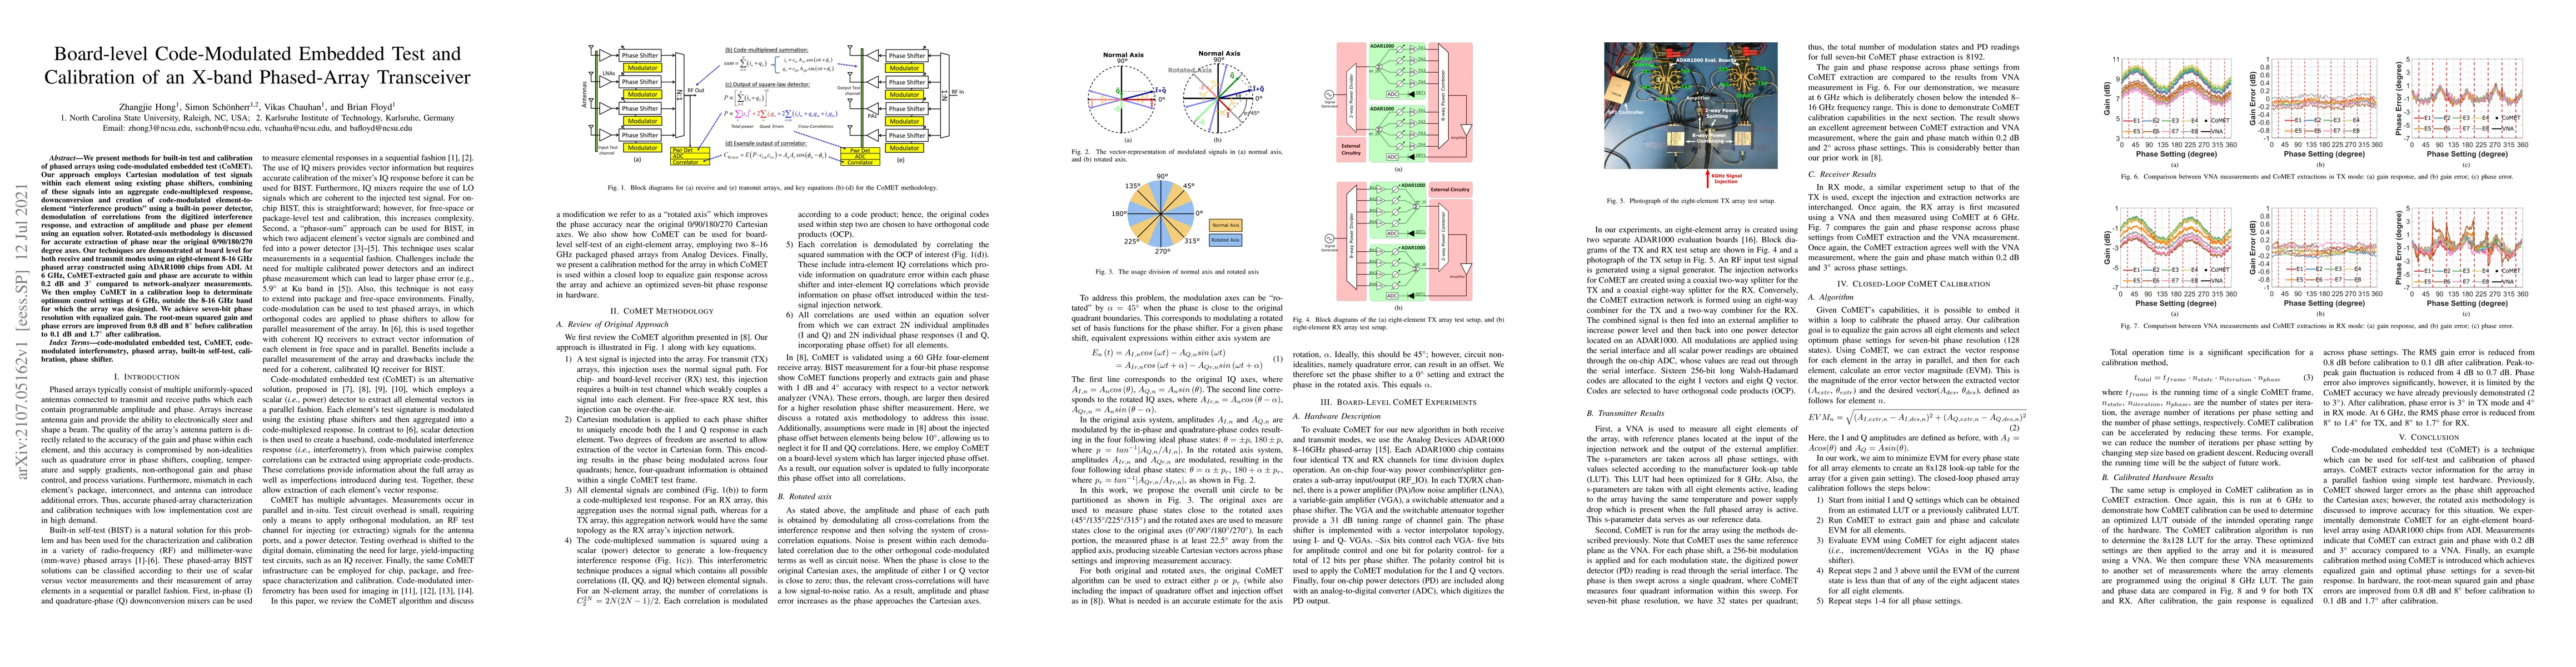
We present methods for built-in test and calibration of phased arrays using code-modulated embedded test (CoMET). Our approach employs Cartesian modulation of test signals within each element using existing phase shifters, combining of these signals into an aggregate code-multiplexed response, downconversion and creation of code-modulated element-to-element "interference products" using a built-in power detector, demodulation of correlations from the digitized interference response, and extraction of amplitude and phase per element using an equation solver. Rotated-axis methodology is discussed for accurate extraction of phase near the original 0/90/180/270 degree axes. Our techniques are demonstrated at board level for both receive and transmit modes using an eight-element 8-16 GHz phased array constructed using ADAR1000 chips from ADI. At 6 GHz, CoMET-extracted gain and phase are accurate to within 0.2 dB and 3 degree compared to network-analyzer measurements. We then employ CoMET in a calibration loop to determinate optimum control settings at 6 GHz, outside the 8-16 GHz band for which the array was designed. We achieve seven-bit phase resolution with equalized gain. The root-mean squared gain and phase errors are improved from 0.8 dB and 8 degree before calibration to 0.1 dB and 1.7 degree after calibration.
AI Key Findings
Get AI-generated insights about this paper's methodology, results, significance, and more — seven facets brought into focus.
Impact
Paper Details
Authors
PDF Preview
Key Terms
Citation Network
Current paper (gray), citations (green), references (blue)
Display is limited for performance on very large graphs.
Discussion 0