Publication
Metrics
Paper Preview
Abstract
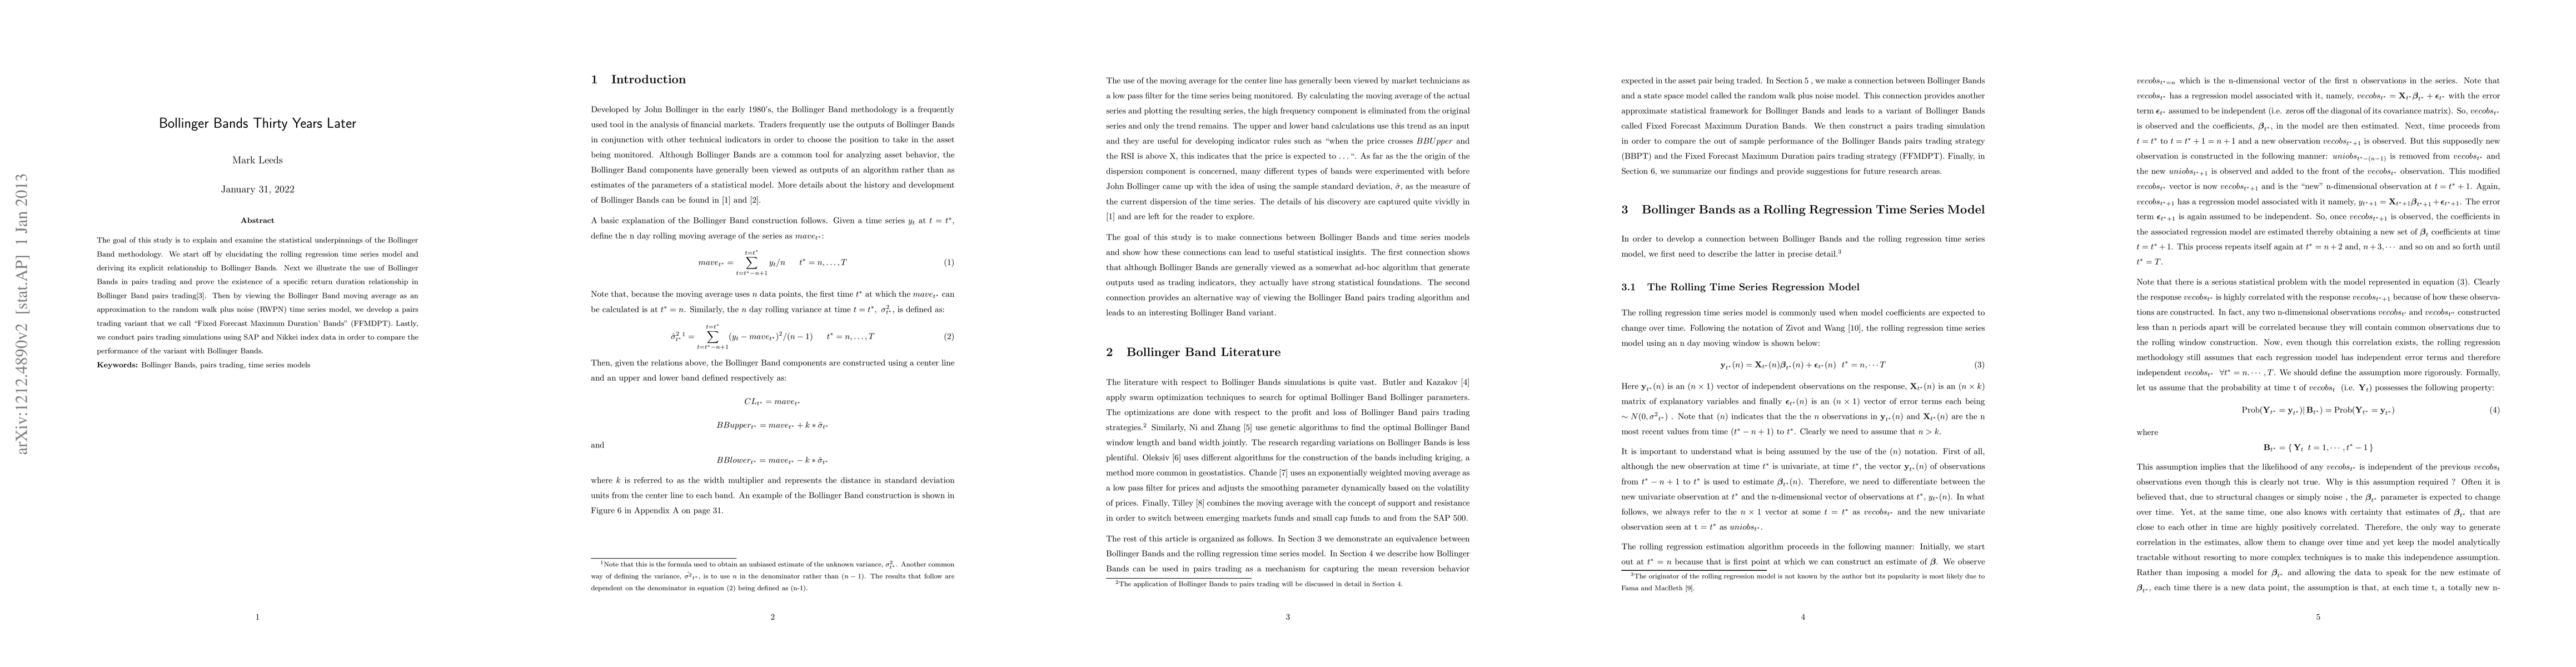
The goal of this study is to explain and examine the statistical underpinnings of the Bollinger Band methodology. We start off by elucidating the rolling regression time series model and deriving its explicit relationship to Bollinger Bands. Next we illustrate the use of Bollinger Bands in pairs trading and prove the existence of a specific return duration relationship in Bollinger Band pairs trading.Then by viewing the Bollinger Band moving average as an approximation to the random walk plus noise (RWPN) time series model, we develop a pairs trading variant that we call "Fixed Forecast Maximum Duration' Bands" (FFMDPT). Lastly, we conduct pairs trading simulations using SAP and Nikkei index data in order to compare the performance of the variant with Bollinger Bands.
AI Key Findings
Get AI-generated insights about this paper's methodology, results, significance, and more — seven facets brought into focus.
Impact
Paper Details
PDF Preview
Key Terms
Citation Network
Current paper (gray), citations (green), references (blue)
Display is limited for performance on very large graphs.
Discussion 0