Boosting Distributional Copula Regression for Bivariate Right-Censored Time-to-Event Data
Publication
Metrics
AI Quick Summary
This paper proposes a flexible distributional copula regression model for analyzing bivariate time-to-event data with right-censoring, specifying dependence and survival distributions separately. It introduces a boosting algorithm for estimation and variable selection, enabling high-dimensional applications, and demonstrates its utility in ovarian cancer research.
Paper Preview
Abstract
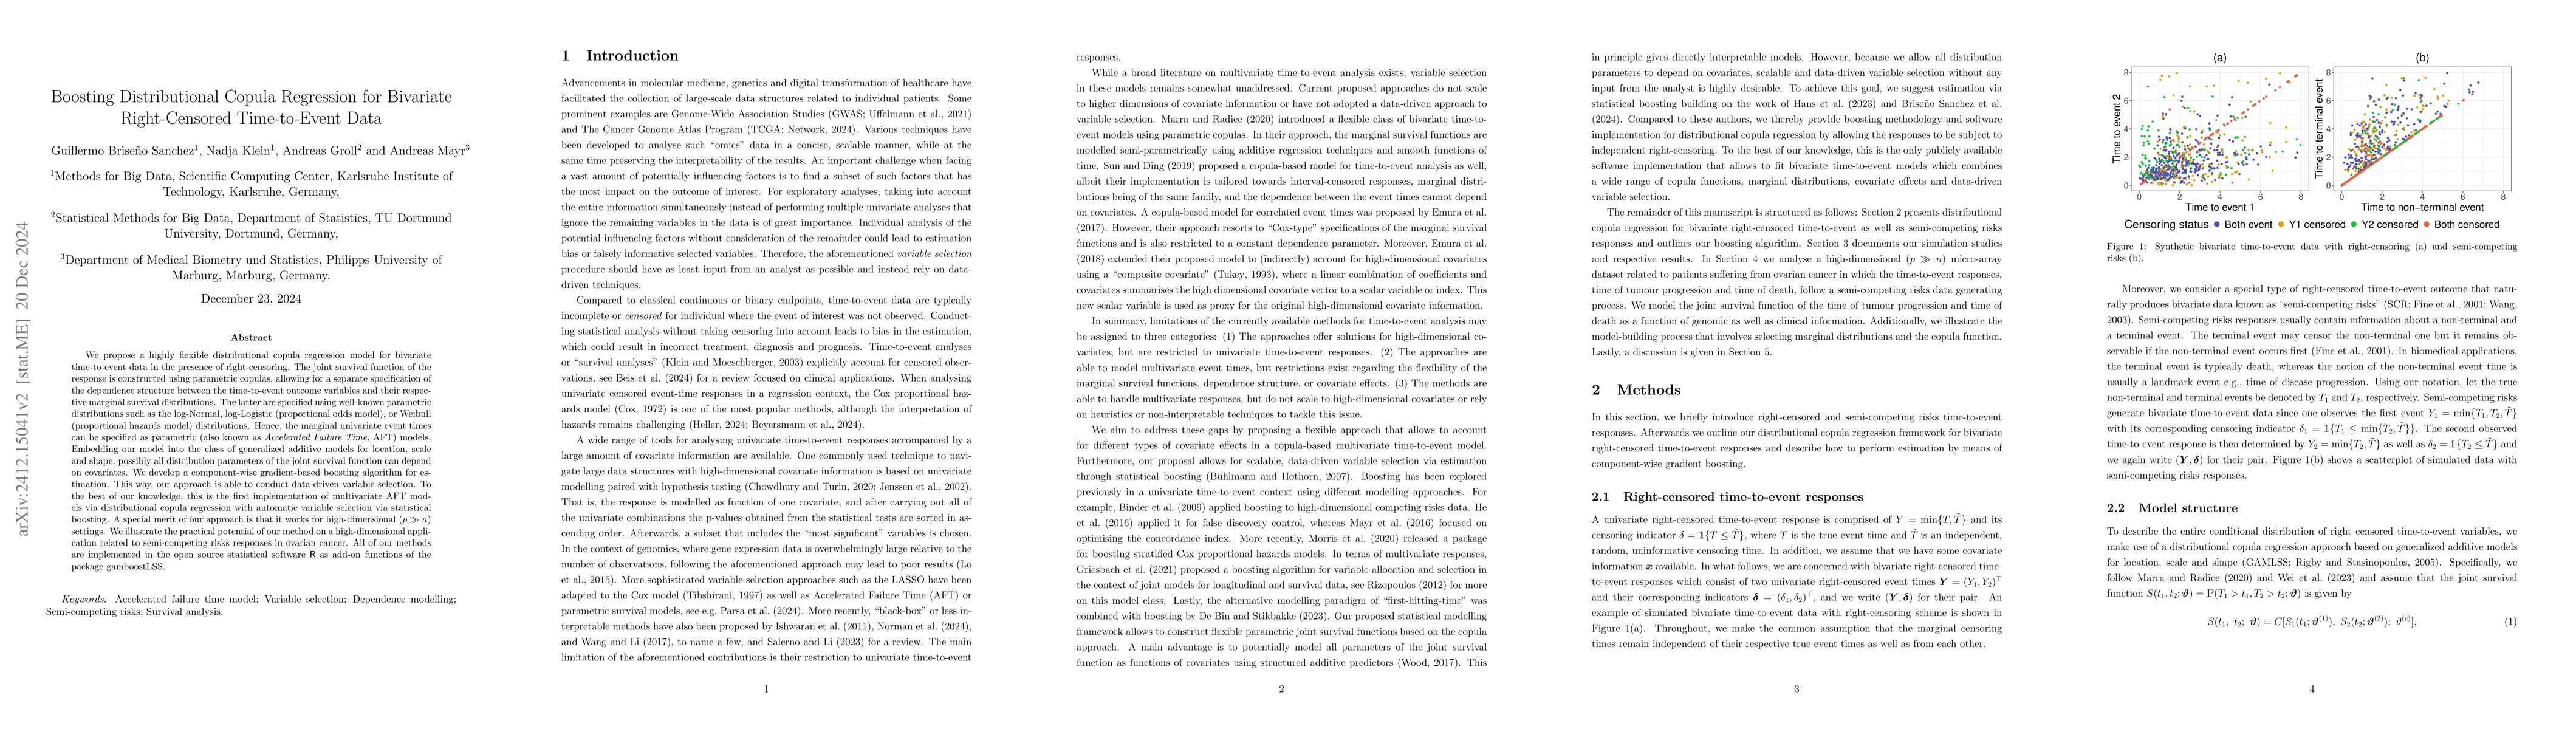
We propose a highly flexible distributional copula regression model for bivariate time-to-event data in the presence of right-censoring. The joint survival function of the response is constructed using parametric copulas, allowing for a separate specification of the dependence structure between the time-to-event outcome variables and their respective marginal survival distributions. The latter are specified using well-known parametric distributions such as the log-Normal, log-Logistic (proportional odds model), or Weibull (proportional hazards model) distributions. Hence, the marginal univariate event times can be specified as parametric (also known as Accelerated Failure Time, AFT) models. Embedding our model into the class of generalized additive models for location, scale and shape, possibly all distribution parameters of the joint survival function can depend on covariates. We develop a component-wise gradient-based boosting algorithm for estimation. This way, our approach is able to conduct data-driven variable selection. To the best of our knowledge, this is the first implementation of multivariate AFT models via distributional copula regression with automatic variable selection via statistical boosting. A special merit of our approach is that it works for high-dimensional (p>>n) settings. We illustrate the practical potential of our method on a high-dimensional application related to semi-competing risks responses in ovarian cancer. All of our methods are implemented in the open source statistical software R as add-on functions of the package gamboostLSS.
AI Key Findings
Get AI-generated insights about this paper's methodology, results, significance, and more — seven facets brought into focus.
Authors
PDF Preview
Related Papers
No references found for this paper.
Discussion 0