Summary
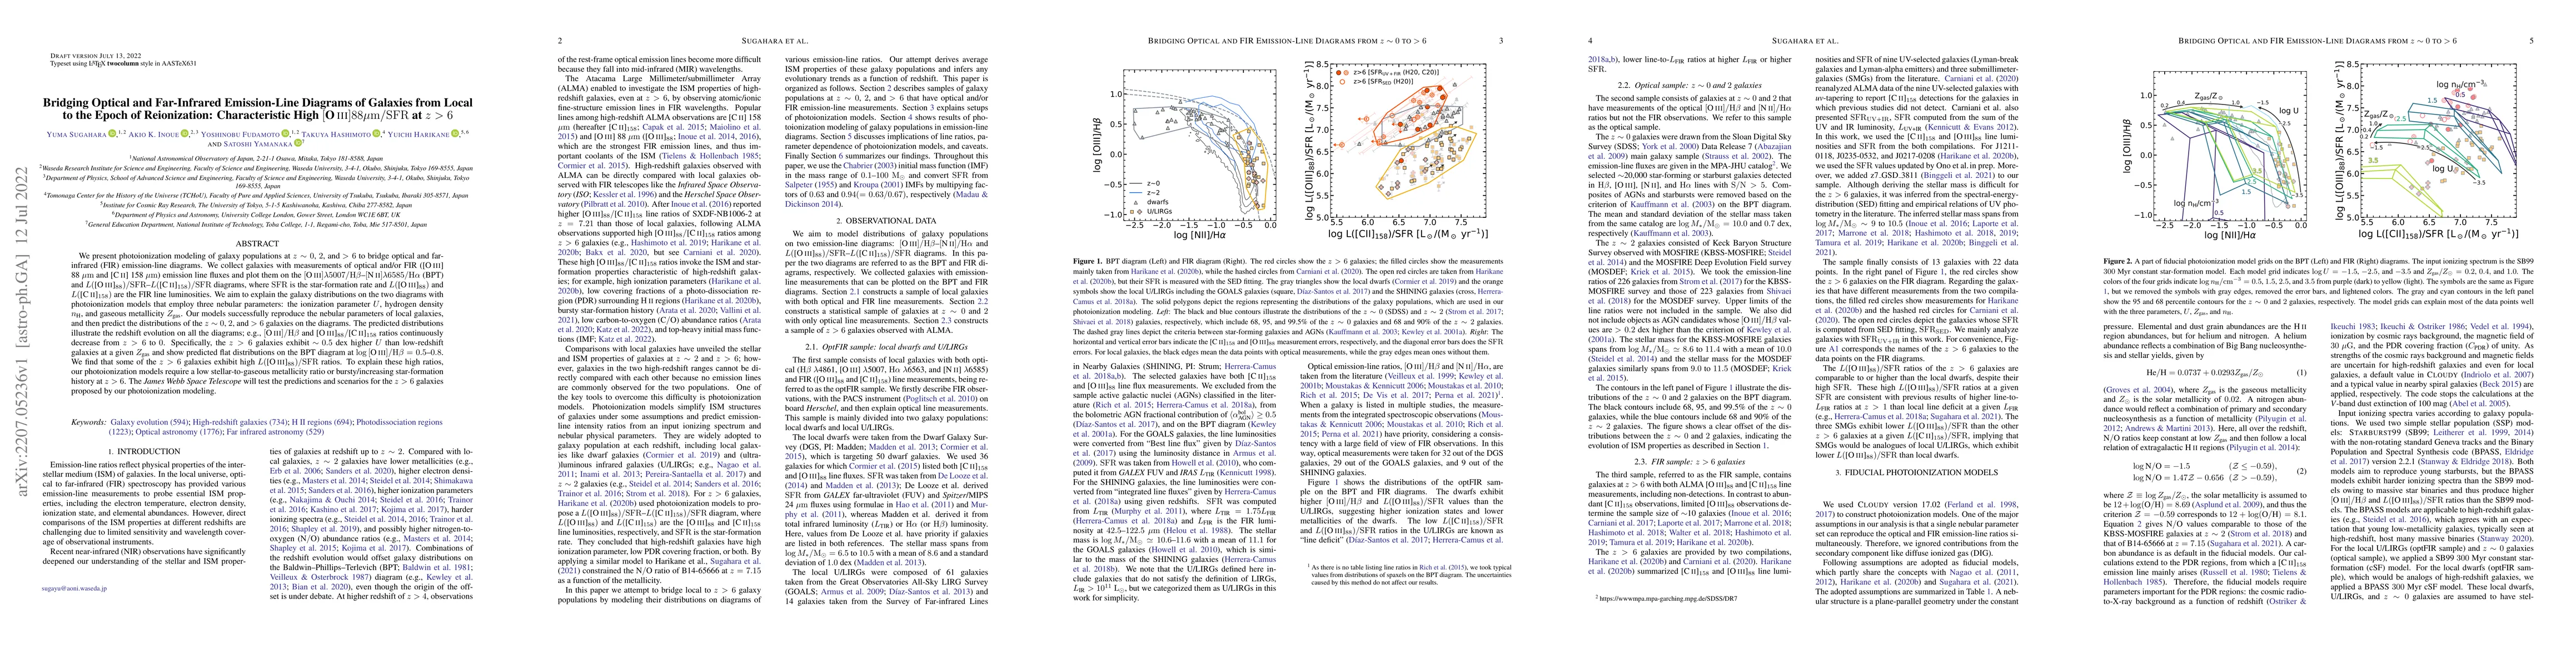
We present photoionization modeling of galaxy populations at $z\sim0$, $2$, and $> 6$ to bridge optical and far-infrared (FIR) emission-line diagrams. We collect galaxies with measurements of optical and/or FIR ([O III] 88 $\mathrm{\mu m}$ and [C II] 158 $\mathrm{\mu m}$) emission line fluxes and plot them on the [O III]$\lambda5007/\mathrm{H\beta}$--[N II]$\lambda6585/\mathrm{H\alpha}$ (BPT) and L([O III]88)/SFR--L([C II]158)/SFR diagrams, where SFR is the star-formation rate and L([O III]88) and L([C II]158) are the FIR line luminosities. We aim to explain the galaxy distributions on the two diagrams with photoionization models that employ three nebular parameters: the ionization parameter $U$, hydrogen density $n_\text{H}$, and gaseous metallicity $Z_\text{gas}$. Our models successfully reproduce the nebular parameters of local galaxies, and then predict the distributions of the $z\sim0$, $2$, and $> 6$ galaxies on the diagrams. The predicted distributions illustrate the redshift evolution on all the diagrams; e.g., [O III]$/\mathrm{H\beta}$ and [O III]88/[C II]158 ratios continuously decrease from $z > 6$ to $0$. Specifically, the $z > 6$ galaxies exhibit $\sim\!0.5$ dex higher $U$ than low-redshift galaxies at a given $Z_\text{gas}$ and show predicted flat distributions on the BPT diagram at $\log{\mathrm{[O III]/H\beta}} = 0.5$-$0.8$. We find that some of the $z > 6$ galaxies exhibit high L([O III]88)/SFR ratios. To explain these high ratios, our photoionization models require a low stellar-to-gaseous metallicity ratio or bursty/increasing star-formation history at $z > 6$. The James Webb Space Telescope will test the predictions and scenarios for the $z > 6$ galaxies proposed by our photoionization modeling.
AI Key Findings
Get AI-generated insights about this paper's methodology, results, and significance.
Paper Details
PDF Preview
Key Terms
Citation Network
Current paper (gray), citations (green), references (blue)
Display is limited for performance on very large graphs.
Similar Papers
Found 4 papersDiagnosing the interstellar medium of galaxies with far-infrared emission lines II. [C II], [O I], [O III], [N II] and [N III] up to z=6
Lingyu Wang, Andrés Felipe Ramos Padilla, F. F. S. van der Tak et al.
Detections of [C II] 158 $\mu$m and [O III] 88 $\mu$m in a Local Lyman Continuum Emitter, Mrk 54, and its Implications to High-redshift ALMA Studies
Tom J. L. C. Bakx, Erik Zackrisson, Matthew Hayes et al.
| Title | Authors | Year | Actions |
|---|
Comments (0)