This paper investigates the knowledge gap between data visualization research and practical application, revealing misalignments and inconsistencies in design guidelines. Through mixed-method research, it identifies practitioners' and researchers' differing perspectives and suggests strategies to better align research findings with real-world design practices.
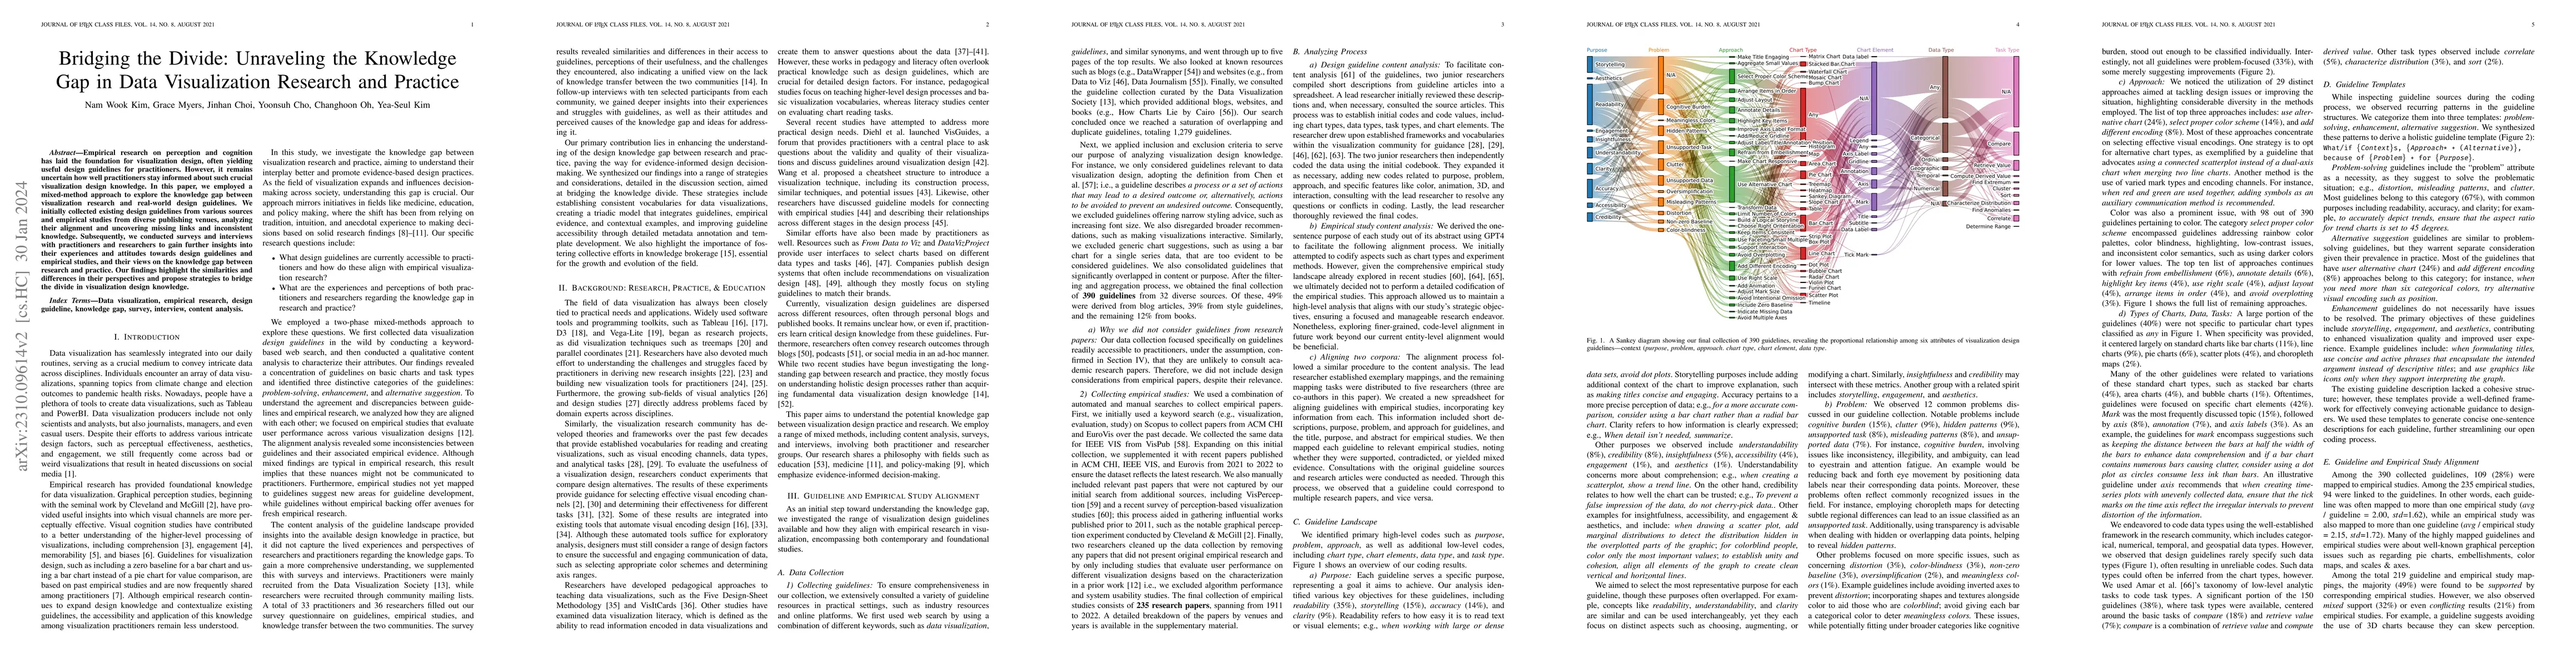
Empirical research on perception and cognition has laid the foundation for visualization design, often yielding useful design guidelines for practitioners. However, it remains uncertain how well practitioners stay informed about such crucial visualization design knowledge. In this paper, we employed a mixed-method approach to explore the knowledge gap between visualization research and real-world design guidelines. We initially collected existing design guidelines from various sources and empirical studies from diverse publishing venues, analyzing their alignment and uncovering missing links and inconsistent knowledge. Subsequently, we conducted surveys and interviews with practitioners and researchers to gain further insights into their experiences and attitudes towards design guidelines and empirical studies, and their views on the knowledge gap between research and practice. Our findings highlight the similarities and differences in their perspectives and propose strategies to bridge the divide in visualization design knowledge.
Get AI-generated insights about this paper's methodology, results, and significance.
Current paper (gray), citations (green), references (blue)
Raesetje Sefala, Alexandra Sasha Luccioni, Giada Pistilli et al.
No citations found for this paper.
Title | Authors | Year | Actions |
---|---|---|---|
How Good is ChatGPT in Giving Advice on Your Visualization Design?
|
Nam Wook Kim, Grace Myers, Benjamin Bach
|
2023
|
View Paper |
Too Many Cooks: Exploring How Graphical Perception Studies Influence Visualization Recommendations in Draco
|
Zehua Zeng, Junran Yang, Dominik Moritz, Jeffrey Heer, L. Battle
|
2023
|
View Paper |
CALVI: Critical Thinking Assessment for Literacy in Visualizations
|
Lily W. Ge, Yuanling Cui, Matthew Kay
|
2023
|
View Paper |
VisLab: Enabling Visualization Designers to Gather Empirically Informed Design Feedback
|
Jinhan Choi, Changhoon Oh, Yea-Seul Kim, N. Kim
|
2023
|
View Paper |
Visualization Design Practices in a Crisis: Behind the Scenes with COVID-19 Dashboard Creators
|
Yixuan Zhang, Yifan Sun, Joseph D. Gaggiano, Neha Kumar, Clio Andris, Andrea G. Parker
|
2022
|
View Paper |
Better Data Visualizations: A Guide for Scholars, Researchers, and Wonks
|
Jacob M. Bilek
|
2022
|
View Paper |
Visualization Accessibility in the Wild: Challenges Faced by Visualization Designers
|
Shakila Cherise S. Joyner, A. Riegelhuth, Kathleen Garrity, Yea-Seul Kim, N. Kim
|
2022
|
View Paper |
Misinformed by Visualization: What Do We Learn From Misinformative Visualizations?
|
Leo Yu-Ho Lo, Ayush Gupta, Kento Shigyo, Aoyu Wu, E. Bertini, Huamin Qu
|
2022
|
View Paper |
A Review and Collation of Graphical Perception Knowledge for Visualization Recommendation
|
Zehua Zeng, L. Battle
|
2021
|
View Paper |
Understanding Data Visualization Design Practice
|
Paul C. Parsons
|
2021
|
View Paper |
A Survey of Perception-Based Visualization Studies by Task
|
Ghulam Jilani Quadri, P. Rosen
|
2021
|
View Paper |
Assessing 2D and 3D Heatmaps for Comparative Analysis: An Empirical Study
|
Matthias Kraus, Katrin Angerbauer, J. Buchmüller, Daniel Schweitzer, D. Keim, M. Sedlmair, Johannes Fuchs
|
2020
|
View Paper |
Data Visualization in Society
|
V. Lechner
|
2020
|
View Paper |
A Task-Based Taxonomy of Cognitive Biases for Information Visualization
|
Evanthia Dimara, S. Franconeri, C. Plaisant, A. Bezerianos, Pierre Dragicevic
|
2020
|
View Paper |
Cheat Sheets for Data Visualization Techniques
|
Zezhong Wang, Lovisa Sundin, Dave Murray-Rust, Benjamin Bach
|
2020
|
View Paper |
Data visualization literacy: Definitions, conceptual frameworks, exercises, and assessments
|
K. Börner, Andreas Bueckle, Michael Ginda
|
2019
|
View Paper |
Vega-Lite: A Grammar of Interactive Graphics
|
Arvind Satyanarayan, Dominik Moritz, Kanit Wongsuphasawat, Jeffrey Heer
|
2018
|
View Paper |
Formalizing Visualization Design Knowledge as Constraints: Actionable and Extensible Models in Draco
|
Dominik Moritz, Chenglong Wang, Greg L. Nelson, Halden Lin, Adam M. Smith, Bill Howe, Jeffrey Heer
|
2018
|
View Paper |
VizML: A Machine Learning Approach to Visualization Recommendation
|
K. Hu, Michiel A. Bakker, Stephen Li, Tim Kraska, César A. Hidalgo
|
2018
|
View Paper |
VisGuides: A Forum for Discussing Visualization Guidelines
|
A. Diehl, Alfie Abdul-Rahman, Mennatallah El-Assady, Benjamin Bach, D. Keim, Min Chen
|
2018
|
View Paper |
Assessing Effects of Task and Data Distribution on the Effectiveness of Visual Encodings
|
Younghoon Kim, Jeffrey Heer
|
2018
|
View Paper |
Somewhere Over the Rainbow: An Empirical Assessment of Quantitative Colormaps
|
Yang Liu, Jeffrey Heer
|
2018
|
View Paper |
Data Illustrator: Augmenting Vector Design Tools with Lazy Data Binding for Expressive Visualization Authoring
|
Zhicheng Liu, John Thompson, Alan Wilson, Mira Dontcheva, James Delorey, Sam Grigg, Bernard Kerr, J. Stasko
|
2018
|
View Paper |
Task-Based Effectiveness of Basic Visualizations
|
B. Saket, A. Endert, Çağatay Demiralp
|
2017
|
View Paper |
Vispubdata.org: A Metadata Collection About IEEE Visualization (VIS) Publications
|
Petra Isenberg, Florian Heimerl, Steffen Koch, Tobias Isenberg, Panpan Xu, Charles D. Stolper, M. Sedlmair, Jian Chen, Torsten Möller, J. Stasko
|
2017
|
View Paper |
Visualization Literacy at Elementary School
|
Basak Alper, N. Riche, Fanny Chevalier, Jeremy Boy, T. M. Sezgin
|
2017
|
View Paper |
An Empire Built On Sand: Reexamining What We Think We Know About Visualization
|
Robert Kosara
|
2016
|
View Paper |
Beyond Memorability: Visualization Recognition and Recall
|
M. Borkin, Z. Bylinskii, N. Kim, C. Bainbridge, Chelsea S. Yeh, Daniel Borkin, H. Pfister, A. Oliva
|
2016
|
View Paper |
Sketching Designs Using the Five Design-Sheet Methodology
|
Jonathan C. Roberts, C. Headleand, Panagiotis D. Ritsos
|
2016
|
View Paper |
Research-Practice Partnerships in Education: "Outcomes, Dynamics, and Open Questions." Conference Paper.
|
C. Coburn, W. Penuel, Caitlin C. Farrell
|
2015
|
View Paper |
The nested blocks and guidelines model
|
Miriah D. Meyer, M. Sedlmair, P. S. Quinan, T. Munzner
|
2015
|
View Paper |
ISOTYPE Visualization: Working Memory, Performance, and Engagement with Pictographs
|
Steve Haroz, Robert Kosara, S. Franconeri
|
2015
|
View Paper |
Conceptualizing Research–Practice Partnerships as Joint Work at Boundaries
|
W. Penuel, Anna‐Ruth Allen, C. Coburn, Caitlin C. Farrell
|
2015
|
View Paper |
Visualization Analysis and Design
|
T. Munzner
|
2014
|
View Paper |
A Principled Way of Assessing Visualization Literacy
|
Jeremy Boy, Ronald A. Rensink, E. Bertini, Jean-Daniel Fekete
|
2014
|
View Paper |
Reflections on how designers design with data
|
Alex Bigelow, S. Drucker, Danyel Fisher, Miriah D. Meyer
|
2014
|
View Paper |
A Multi-Level Typology of Abstract Visualization Tasks
|
M. Brehmer, T. Munzner
|
2013
|
View Paper |
An Empirical Study on Using Visual Embellishments in Visualization
|
R. Borgo, Alfie Abdul-Rahman, Farhan Mohamed, P. W. Grant, I. Reppa, L. Floridi, Min Chen
|
2012
|
View Paper |
Design Study Methodology: Reflections from the Trenches and the Stacks
|
M. Sedlmair, Miriah D. Meyer, T. Munzner
|
2012
|
View Paper |
Empirical Studies in Information Visualization: Seven Scenarios
|
Heidi Lam, E. Bertini, Petra Isenberg, C. Plaisant, Sheelagh Carpendale
|
2012
|
View Paper |
Building Successful Online Communities: Evidence-Based Social Design
|
R. Kraut, P. Resnick, S. Kiesler, Yuqing Ren, Yan Chen, Moira Burke, Niki Kittur, J. Riedl, J. Konstan
|
2012
|
View Paper |
D³ Data-Driven Documents
|
M. Bostock, Vadim Ogievetsky, Jeffrey Heer
|
2011
|
View Paper |
Evidence-Based Policymaking: Insights from Policy-Minded Researchers and Research-Minded Policymakers
|
B. Settles
|
2011
|
View Paper |
Crowdsourcing graphical perception: using mechanical turk to assess visualization design
|
Jeffrey Heer, M. Bostock
|
2010
|
View Paper |
Useful junk?: the effects of visual embellishment on comprehension and memorability of charts
|
Scott Bateman, R. Mandryk, C. Gutwin, Aaron Genest, D. McDine, Christopher A. Brooks
|
2010
|
View Paper |
Low-level components of analytic activity in information visualization
|
R. Amar, James R. Eagan, J. Stasko
|
2005
|
View Paper |
Polaris: a system for query, analysis and visualization of multi-dimensional relational databases
|
Chris Stolte, Diane Tang, P. Hanrahan
|
2000
|
View Paper |
Rethinking validity and reliability in content analysis
|
W. Potter, D. Levine-Donnerstein
|
1999
|
View Paper |
What is Evidence-based Education?
|
P. Davies
|
1999
|
View Paper |
Tree-maps: a space-filling approach to the visualization of hierarchical information structures
|
Brian Johnson, B. Shneiderman
|
1991
|
View Paper |
Parallel coordinates: a tool for visualizing multi-dimensional geometry
|
A. Inselberg, B. Dimsdale
|
1990
|
View Paper |
Graphical Perception: Theory, Experimentation, and Application to the Development of Graphical Methods
|
W. Cleveland, R. McGill
|
1984
|
View Paper |
Datawrapper
|
2021
|
View Paper | |
How charts lie: Getting smarter about visual information
|
2019
|
||
Presenting Visualization Guideline Collections
|
James Scott-Brown
|
2018
|
View Paper |
Pathways for Theoretical Advances in Visualization
|
Min Chen, G. Grinstein, Chris R. Johnson, J. Kennedy, Melanie Tory
|
2017
|
View Paper |
Data-Driven Guides: Supporting Expressive Design for Information Graphics
|
N. Kim, Eston Schweickart, Zhicheng Liu, Mira Dontcheva, Wilmot Li, J. Popović, H. Pfister
|
2017
|
View Paper |
VizItCards: A Card-Based Toolkit for Infovis Design Education
|
Shiqing He, Eytan Adar
|
2017
|
View Paper |
VLAT: Development of a Visualization Literacy Assessment Test
|
Sukwon Lee, Sung-Hee Kim, Bum Chul Kwon
|
2017
|
View Paper |
BMC Health Services Research BioMed Central Study protocol Knowledge brokering: Exploring the process of transferring
|
2008
|
View Paper | |
Illuminating the Path: The Research and Development Agenda for Visual Analytics
|
James J. Thomas, Kristin A. Cook
|
2005
|
View Paper |
Evidence-based practice.
|
Research Committee (Victorian Branch) Of The Austr
|
1999
|
View Paper |
“Data to viz,”
|
|||
“Data viz project,”
|
|||
“Visperception,”
|
|||
“Storytelling with data - community forum,”
|
|||
“Tableau - tableau official site,”
|
|||
“Multiple views: Visualization research explained,”
|
|||
“Datajournalism.com,”
|
|||
“Financial times visual vocabulary,”
|
|||
“vega/voyager: Visualization tool for data exploration - github,”
|
|||
“Sustainable peer review via incentive aligned markets,”
|
|||
“Flowing data,”
|
|||
“Google design system,”
|
Showing first page preview. Click "Open Full PDF" to view the complete paper.
Your comment contains inappropriate language and has been rejected.
Are you sure you want to remove this tag? This action cannot be undone.
Someone just favorited a paper!
Comments (0)