brolgar: An R package to BRowse Over Longitudinal Data Graphically and Analytically in R
Publication
Metrics
AI Quick Summary
The R package brolgar is introduced for visualizing and analyzing longitudinal data, offering tools to identify and summarize unique individual patterns, addressing limitations of spaghetti plots and traditional hierarchical linear models in capturing individual experiences and unusual patterns.
Paper Preview
Abstract
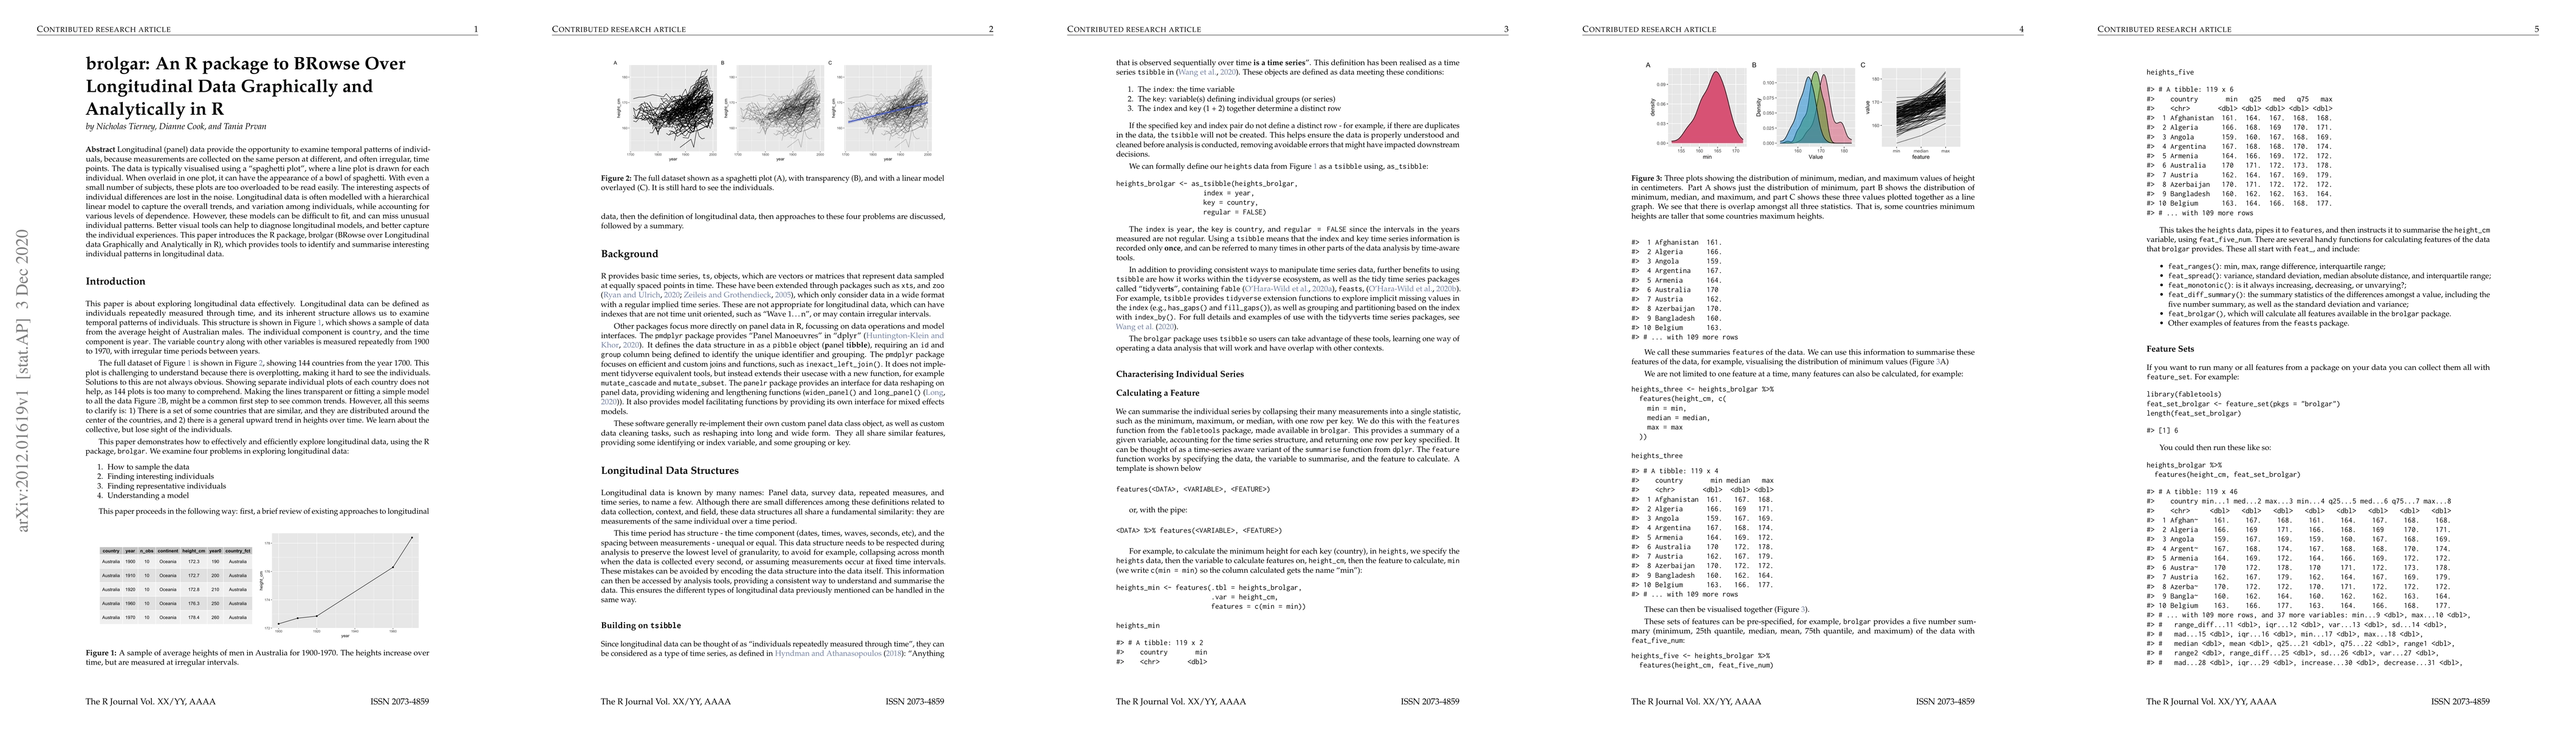
Longitudinal (panel) data provide the opportunity to examine temporal patterns of individuals, because measurements are collected on the same person at different, and often irregular, time points. The data is typically visualised using a "spaghetti plot", where a line plot is drawn for each individual. When overlaid in one plot, it can have the appearance of a bowl of spaghetti. With even a small number of subjects, these plots are too overloaded to be read easily. The interesting aspects of individual differences are lost in the noise. Longitudinal data is often modelled with a hierarchical linear model to capture the overall trends, and variation among individuals, while accounting for various levels of dependence. However, these models can be difficult to fit, and can miss unusual individual patterns. Better visual tools can help to diagnose longitudinal models, and better capture the individual experiences. This paper introduces the R package, brolgar (BRowse over Longitudinal data Graphically and Analytically in R), which provides tools to identify and summarise interesting individual patterns in longitudinal data.
AI Key Findings
Get AI-generated insights about this paper's methodology, results, significance, and more — seven facets brought into focus.
Impact
Paper Details
Authors
PDF Preview
Key Terms
Citation Network
Current paper (gray), citations (green), references (blue)
Display is limited for performance on very large graphs.
Discussion 0