Summary
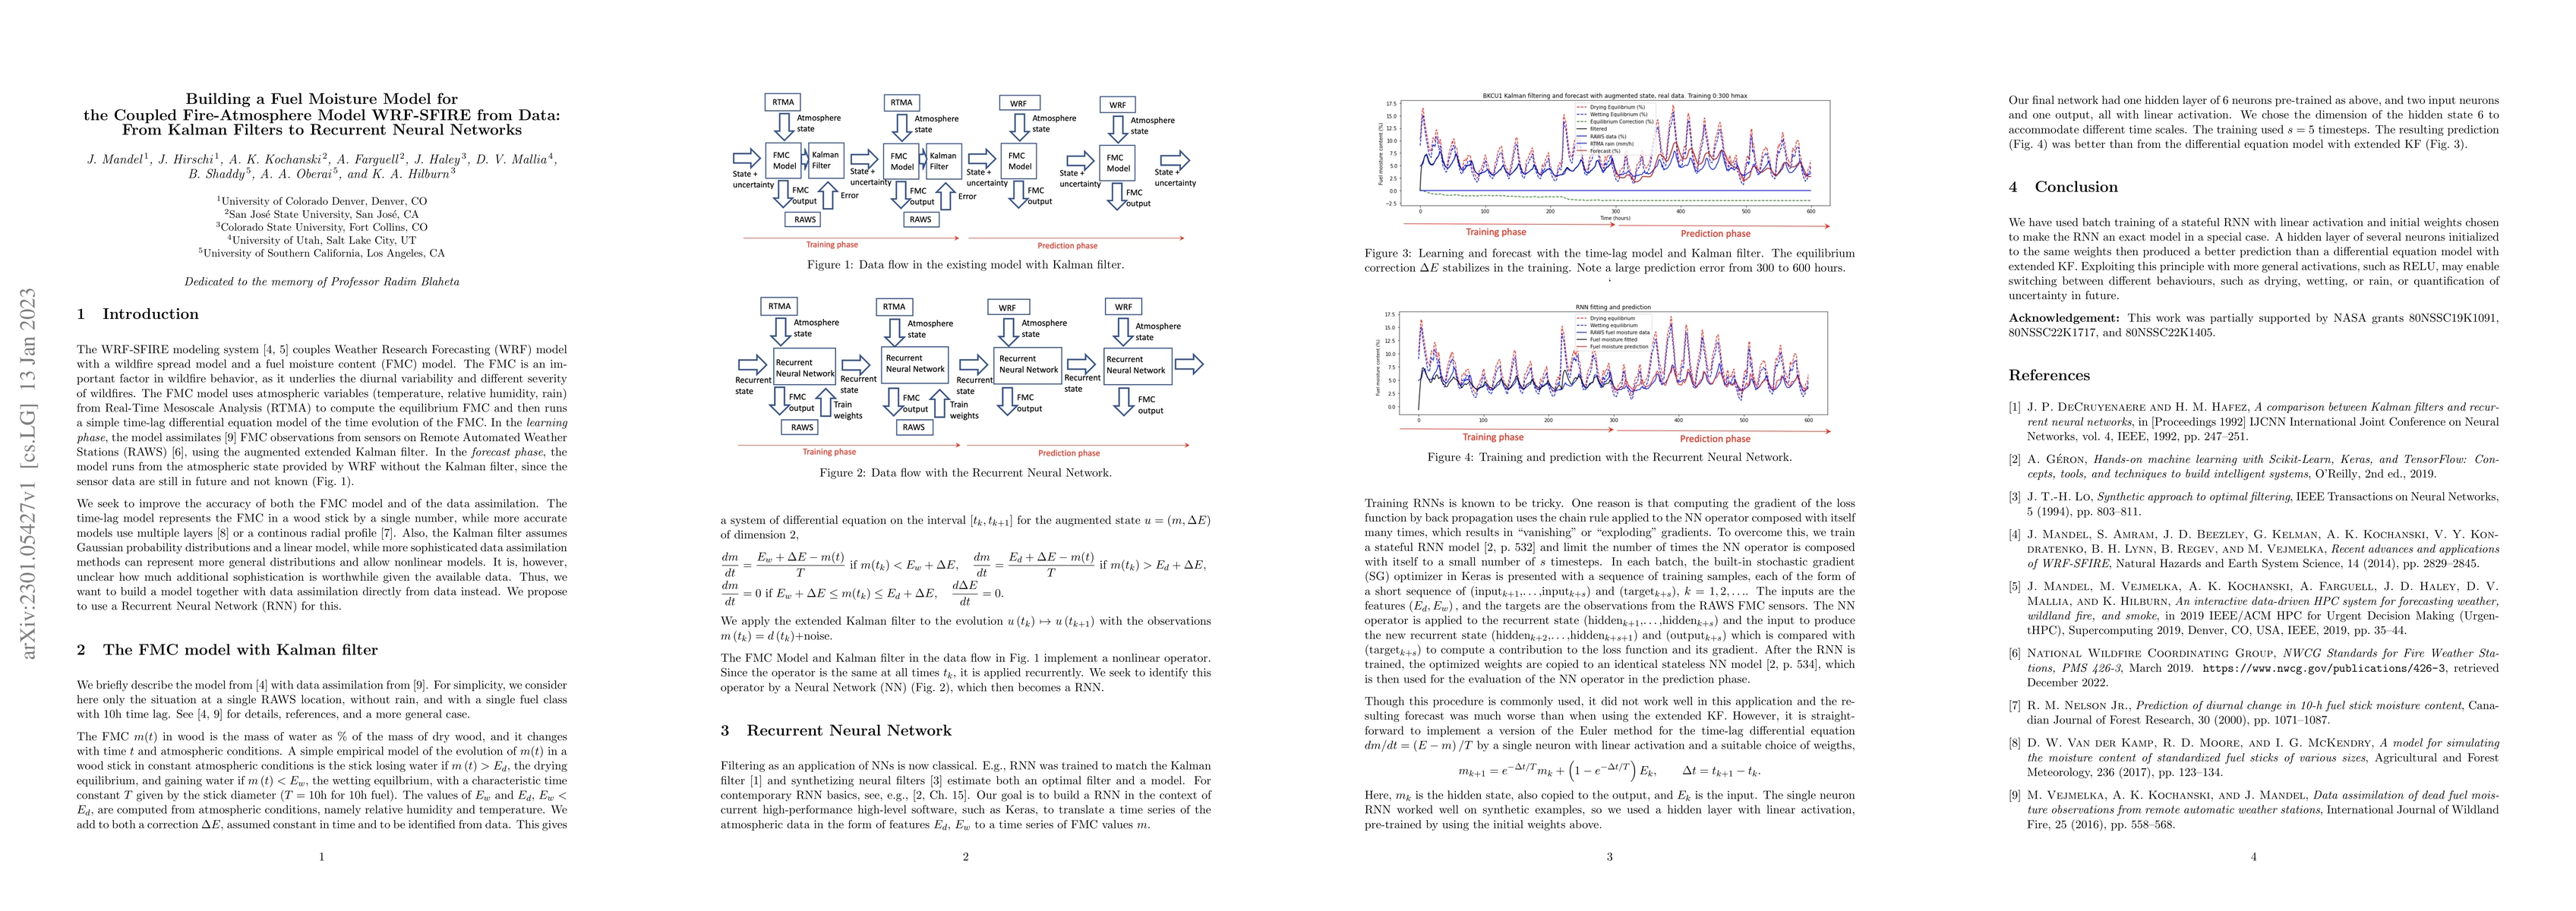
The current fuel moisture content (FMC) subsystems in WRF-SFIRE and its workflow system WRFx use a time-lag differential equation model with assimilation of data from FMC sensors on Remote Automated Weather Stations (RAWS) by the extended augmented Kalman filter. But the quality of the result is constrained by the limitations of the model and of the Kalman filter. We observe that the data flow in a system consisting of a model and the Kalman filter can be interpreted to be the same as the data flow in a recurrent neural network (RNN). Thus, instead of building more sophisticated models and data assimilation methods, we want to train a RNN to approximate the dynamics of the response of the FMC sensor to a time series of environmental data. Because standard AI approaches did not converge to reasonable solutions, we pre-train the RNN with special initial weights devised to turn it into a numerical solver of the differential equation. We then allow the AI training machinery to optimize the RNN weights to fit the data better. We illustrate the method on an example of a time series of 10h-FMC from RAWS and weather data from the Real-Time Mesoscale Analysis (RTMA).
AI Key Findings
Generated Sep 07, 2025
Methodology
The research used a Recurrent Neural Network (RNN) to approximate the dynamics of the response of the FMC sensor to a time series of environmental data.
Key Results
- The RNN model produced better predictions than the existing differential equation model with extended Kalman filter.
- The RNN model was trained using batch training with linear activation and initial weights chosen to make the RNN an exact model in a special case.
- The hidden layer of the RNN had 6 neurons, pre-trained by using initial weights, and produced better results than the existing differential equation model.
Significance
This research is important because it improves the accuracy of the FMC model and data assimilation, which are crucial for predicting wildfire behavior.
Technical Contribution
The main technical contribution is the use of RNNs for data assimilation and prediction of FMC values.
Novelty
This work is novel because it uses RNNs as a direct alternative to Kalman filters for data assimilation, which is a common approach in signal processing.
Limitations
- The RNN model may not generalize well to other environments or conditions.
- The training process was limited by the choice of initial weights and activation function.
Future Work
- Exploring more general activations, such as ReLU, to enable switching between different behaviors.
- Developing a more robust training procedure to handle variations in environmental conditions.
Paper Details
PDF Preview
Key Terms
Citation Network
Current paper (gray), citations (green), references (blue)
Display is limited for performance on very large graphs.
No citations found for this paper.
Comments (0)