Building the Collaboration Graph of Open-Source Software Ecosystem
Publication
Metrics
AI Quick Summary
This paper explores the collaboration structure within the open-source software ecosystem using an interactive collaboration graph derived from World of Code data. Despite challenges in visualizing the entire graph due to its scale, the authors filtered the data to create an interactive visualization and plan to incorporate hierarchical approaches for full-scale visualizations.
Paper Preview
Abstract
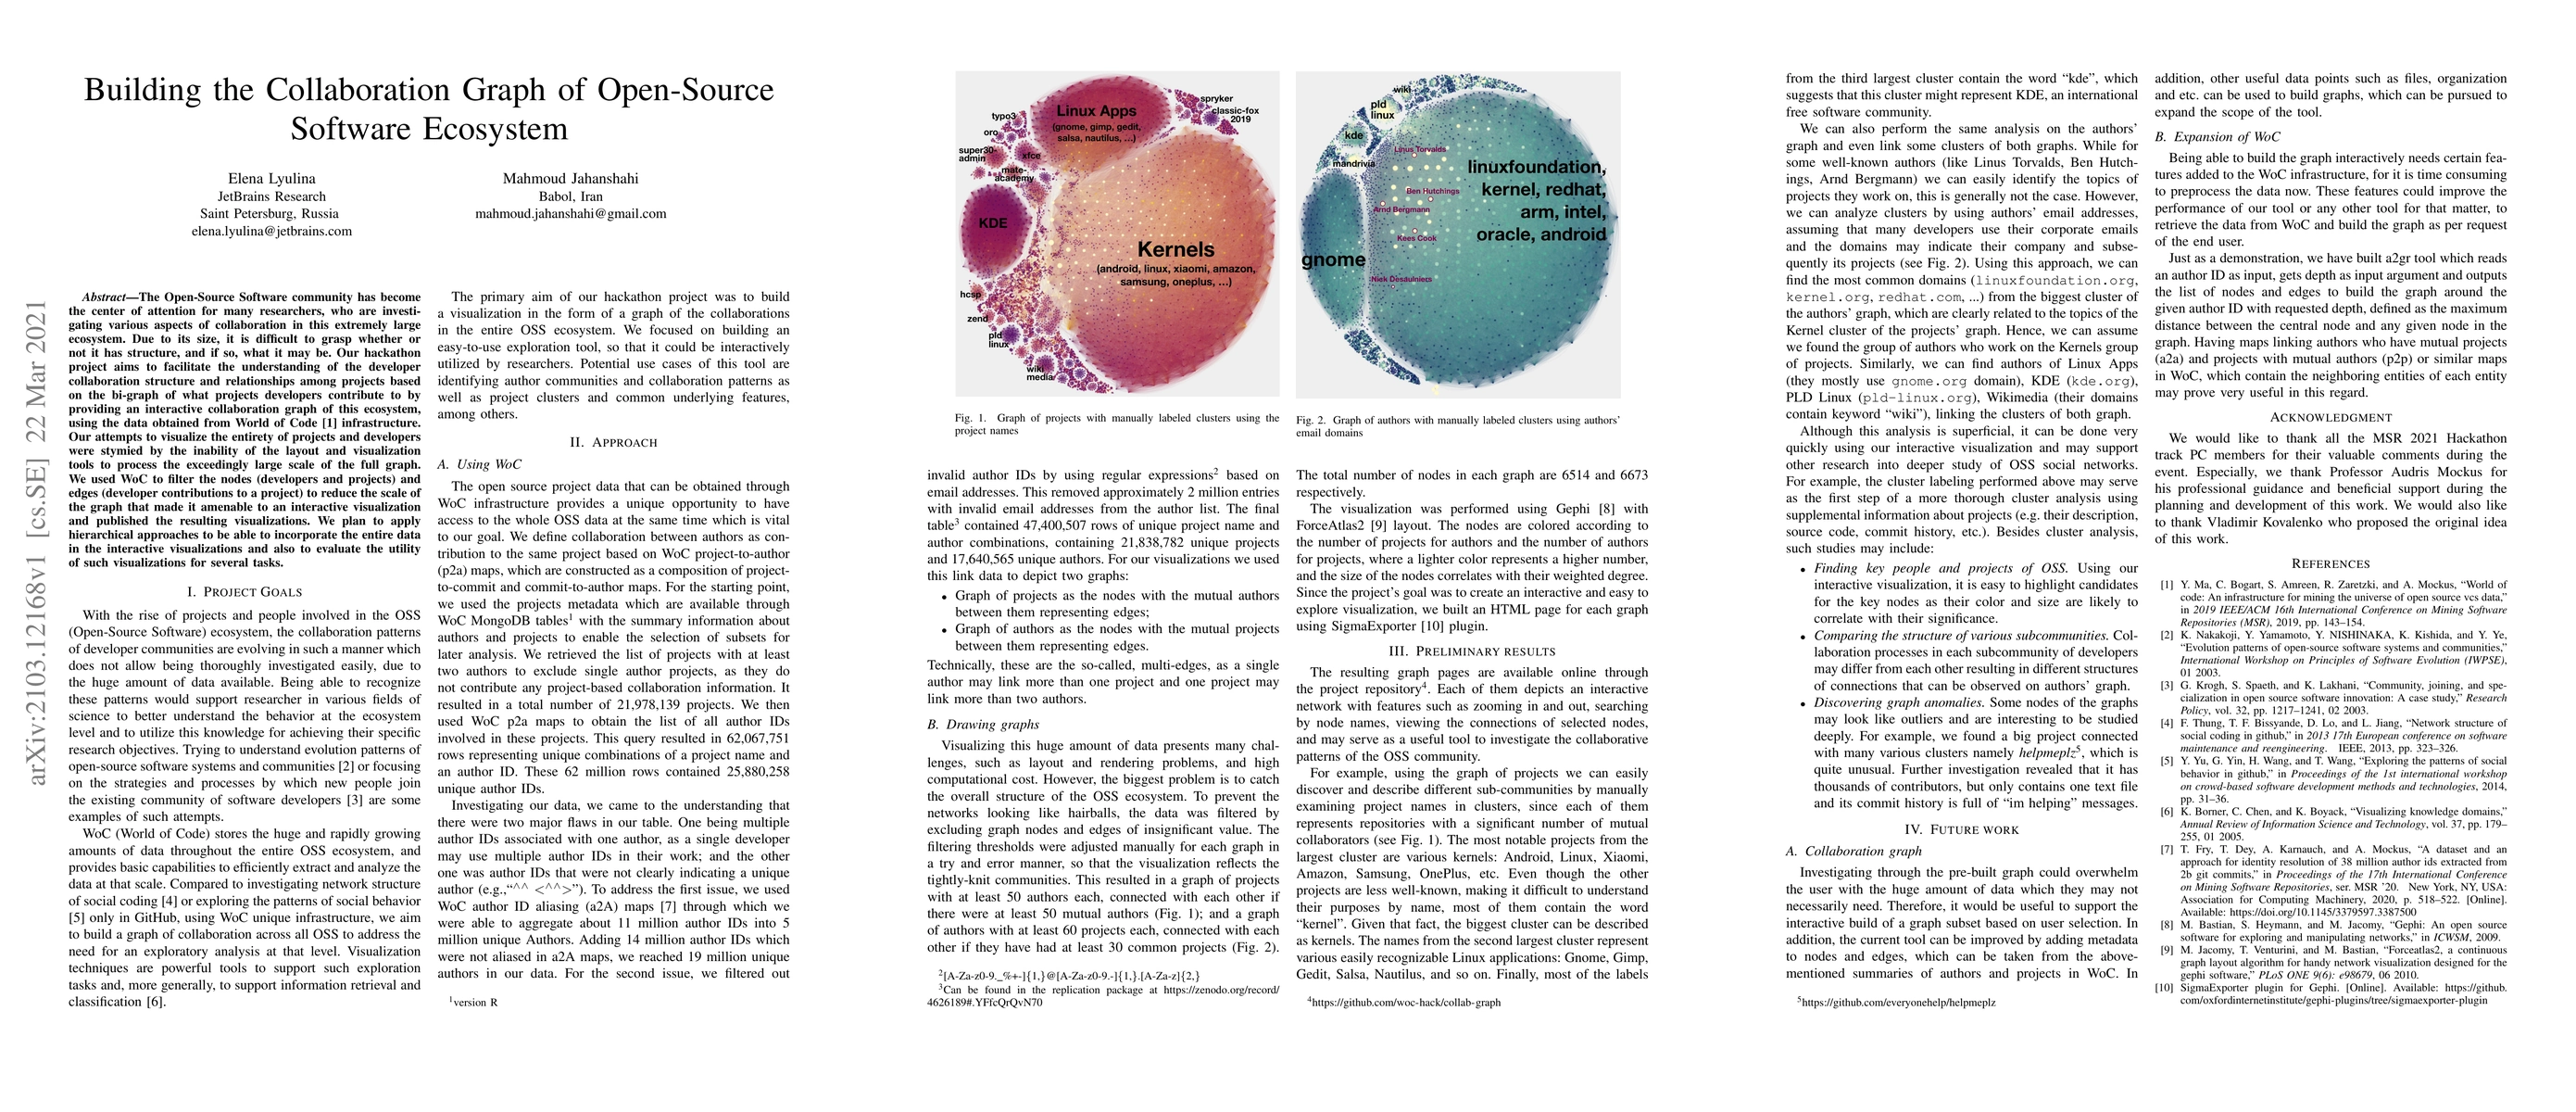
The Open-Source Software community has become the center of attention for many researchers, who are investigating various aspects of collaboration in this extremely large ecosystem. Due to its size, it is difficult to grasp whether or not it has structure, and if so, what it may be. Our hackathon project aims to facilitate the understanding of the developer collaboration structure and relationships among projects based on the bi-graph of what projects developers contribute to by providing an interactive collaboration graph of this ecosystem, using the data obtained from World of Code infrastructure. Our attempts to visualize the entirety of projects and developers were stymied by the inability of the layout and visualization tools to process the exceedingly large scale of the full graph. We used WoC to filter the nodes (developers and projects) and edges (developer contributions to a project) to reduce the scale of the graph that made it amenable to an interactive visualization and published the resulting visualizations. We plan to apply hierarchical approaches to be able to incorporate the entire data in the interactive visualizations and also to evaluate the utility of such visualizations for several tasks.
AI Key Findings
Get AI-generated insights about this paper's methodology, results, significance, and more — seven facets brought into focus.
Impact
Paper Details
Authors
PDF Preview
Key Terms
Citation Network
Current paper (gray), citations (green), references (blue)
Display is limited for performance on very large graphs.
Discussion 0