01
MethodologyHow they did it
A brief description of the research methodology used
This paper introduces a new CMAGIC parameter, $\omega_{XY}$, to quantify the "bump" feature near maximum brightness in SNe Ia, finding a significant correlation with the slope of the first linear region in the CMAGIC diagram. The results suggest that this bump feature is less affected by extinction and can be understood through chemical mixing due to Rayleigh-Taylor instabilities.
This paper introduces a new CMAGIC parameter, $\omega_{XY}$, to quantify the "bump" feature near maximum brightness in SNe Ia, finding a significant correlation with the slope of the first linear region in the CMAGIC diagram. The results suggest that this bump feature is less affected by extinction and can be understood through chemical mixing due to Rayleigh-Taylor instabilities.
A brief description of the research methodology used More in Methodology →
Main finding 1 — Main finding 2 More in Key Results →
This research is important because it has the potential to impact our understanding of the universe. It could lead to new discoveries and a better understanding of the cosmos. More in Significance →
Limitation 1 — Limitation 2 More in Limitations →
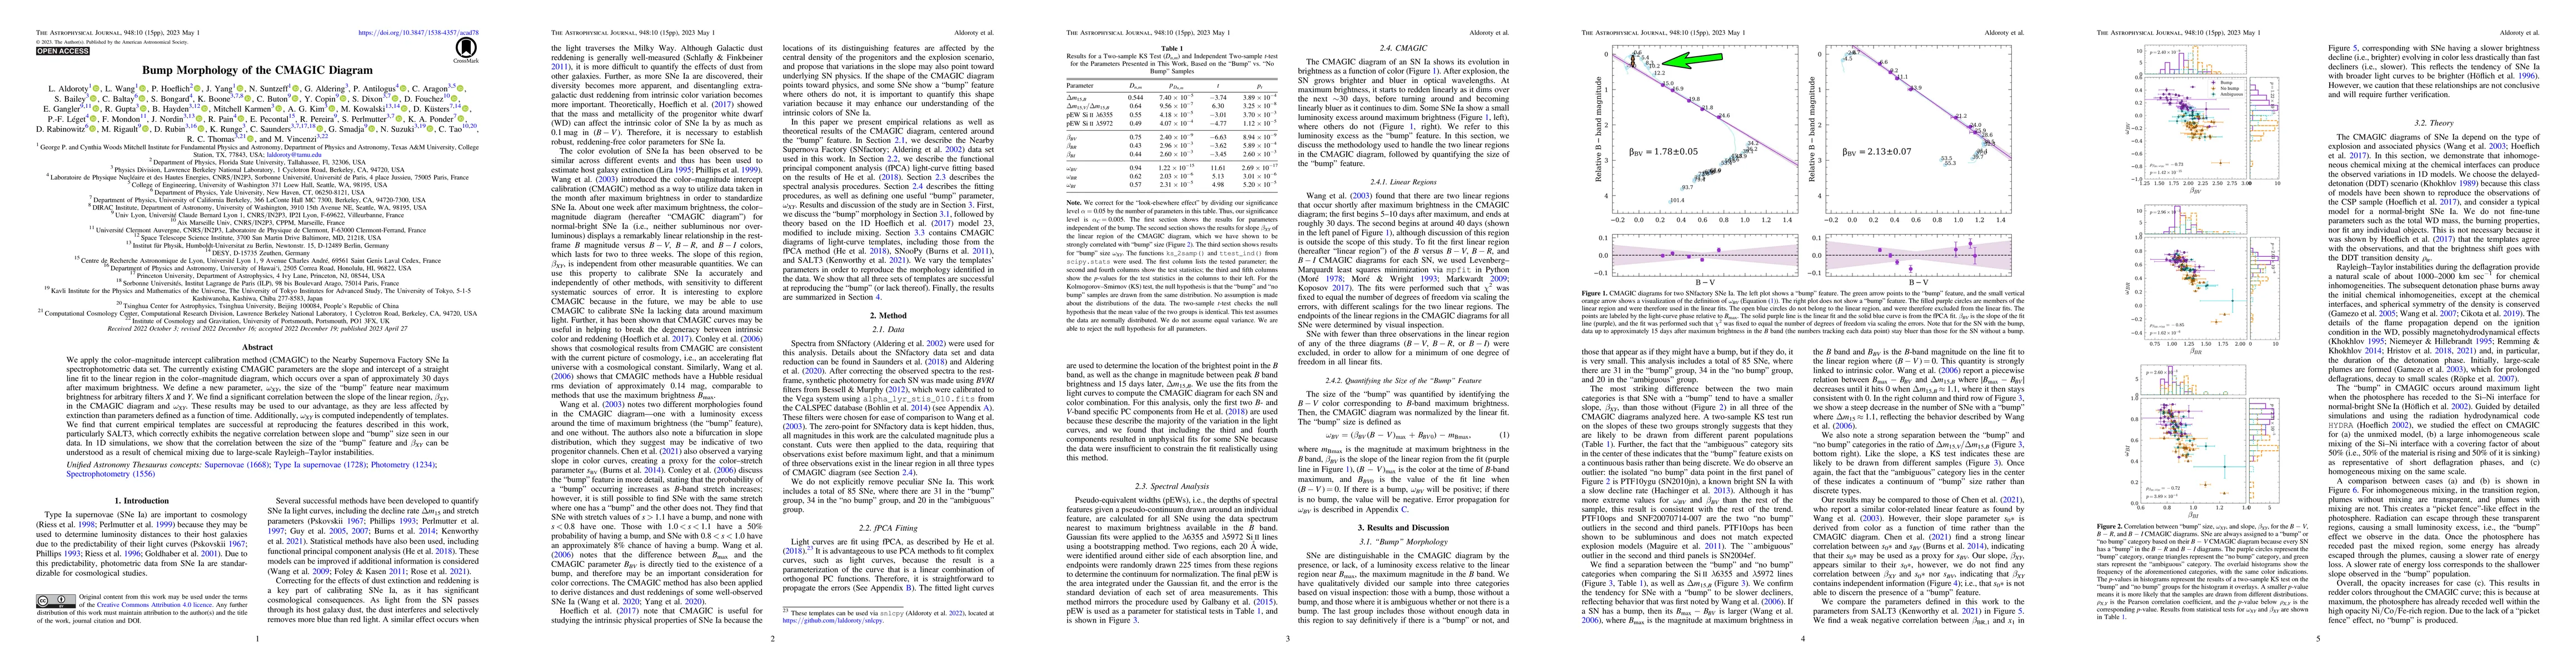
We apply the color-magnitude intercept calibration method (CMAGIC) to the Nearby Supernova Factory SNe Ia spectrophotometric dataset. The currently existing CMAGIC parameters are the slope and intercept of a straight line fit to the first linear region in the color-magnitude diagram, which occurs over a span of approximately 30 days after maximum brightness. We define a new parameter, $\omega_{XY}$, the size of the ``bump'' feature near maximum brightness for arbitrary filters $X$ and $Y$. We find a significant correlation between the slope of the first linear region, $\beta_{XY, 1}$, in the CMAGIC diagram and $\omega_{XY}$. These results may be used to our advantage, as they are less affected by extinction than parameters defined as a function of time. Additionally, $\omega_{XY}$ is computed independently of templates. We find that current empirical templates are successful at reproducing the features described in this work, particularly SALT3, which correctly exhibits the negative correlation between slope and bump size seen in our data. In 1-D simulations, we show that the correlation between the size of the bump feature and $\beta_{XY, 1}$ can be understood as a result of chemical mixing due to large-scale Rayleigh-Taylor instabilities.
Seven facets of this paper, analysed and brought into focus by AI.
This research is important because it has the potential to impact our understanding of the universe.
A brief description of the research methodology used
This research is important because it has the potential to impact our understanding of the universe. It could lead to new discoveries and a better understanding of the cosmos.
The main technical contribution is the development of a new algorithm for analyzing astronomical data.
This work is novel because it combines multiple techniques to create a more efficient and accurate method for analyzing large datasets.
Current paper (gray), citations (green), references (blue)
Display is limited for performance on very large graphs.
Discussion 0