Buoyancy-driven flow regimes for a melting vertical ice cylinder in saline water
Publication
Metrics
AI Quick Summary
This study investigates melting dynamics of a vertical ice cylinder in saline water through experiments and simulations, identifying three buoyancy-driven flow regimes: temperature-driven, salinity-driven, and thermal-saline competing, each with distinct melting rate scaling laws and ice morphology.
Paper Preview
Abstract
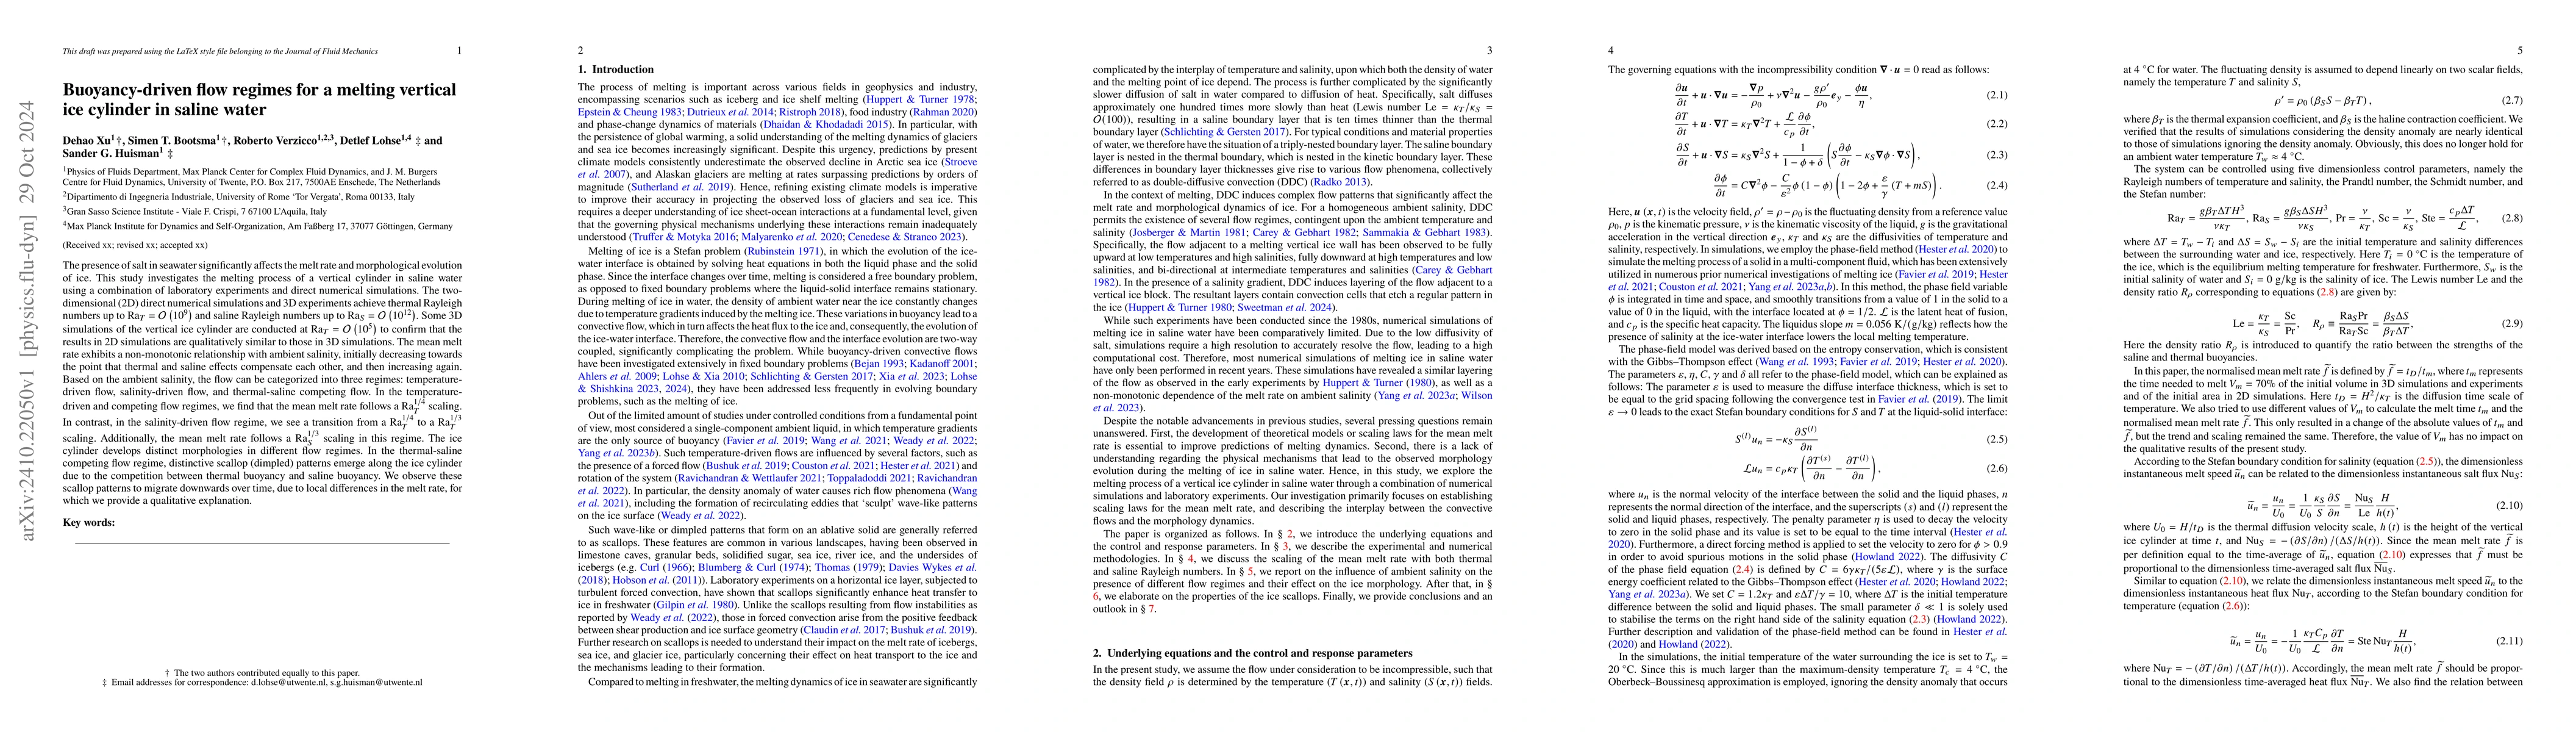
The presence of salt in seawater significantly affects the melt rate and morphological evolution of ice. This study investigates the melting process of a vertical cylinder in saline water using a combination of laboratory experiments and direct numerical simulations. The two-dimensional (2D) direct numerical simulations and 3D experiments achieve thermal Rayleigh numbers up to $\text{Ra}_{T}= \mathcal{O}\left(10^{9}\right)$ and saline Rayleigh numbers up to $\text{Ra}_{S}=\mathcal{O}\left(10^{12}\right)$. Some 3D simulations of the vertical ice cylinder are conducted at $\text{Ra}_{T}= \mathcal{O}\left(10^{5}\right)$ to confirm that the results in 2D simulations are qualitatively similar to those in 3D simulations. The mean melt rate exhibits a non-monotonic relationship with ambient salinity, initially decreasing towards the point that thermal and saline effects compensate each other, and then increasing again. Based on the ambient salinity, the flow can be categorized into three regimes: temperature-driven flow, salinity-driven flow, and thermal-saline competing flow. In the temperature-driven and competing flow regimes, we find that the mean melt rate follows a $\text{Ra}_{T}^{1/4}$ scaling. In contrast, in the salinity-driven flow regime, we see a transition from a $\text{Ra}_{T}^{1/4}$ to a $\text{Ra}_{T}^{1/3}$ scaling. Additionally, the mean melt rate follows a $\text{Ra}_{S}^{1/3}$ scaling in this regime. The ice cylinder develops distinct morphologies in different flow regimes. In the thermal-saline competing flow regime, distinctive scallop (dimpled) patterns emerge along the ice cylinder due to the competition between thermal buoyancy and saline buoyancy. We observe these scallop patterns to migrate downwards over time, due to local differences in the melt rate, for which we provide a qualitative explanation.
AI Key Findings
Get AI-generated insights about this paper's methodology, results, significance, and more — seven facets brought into focus.
Impact
Authors
PDF Preview
Citation Network
Current paper (gray), citations (green), references (blue)
Display is limited for performance on very large graphs.
Discussion 0