Summary
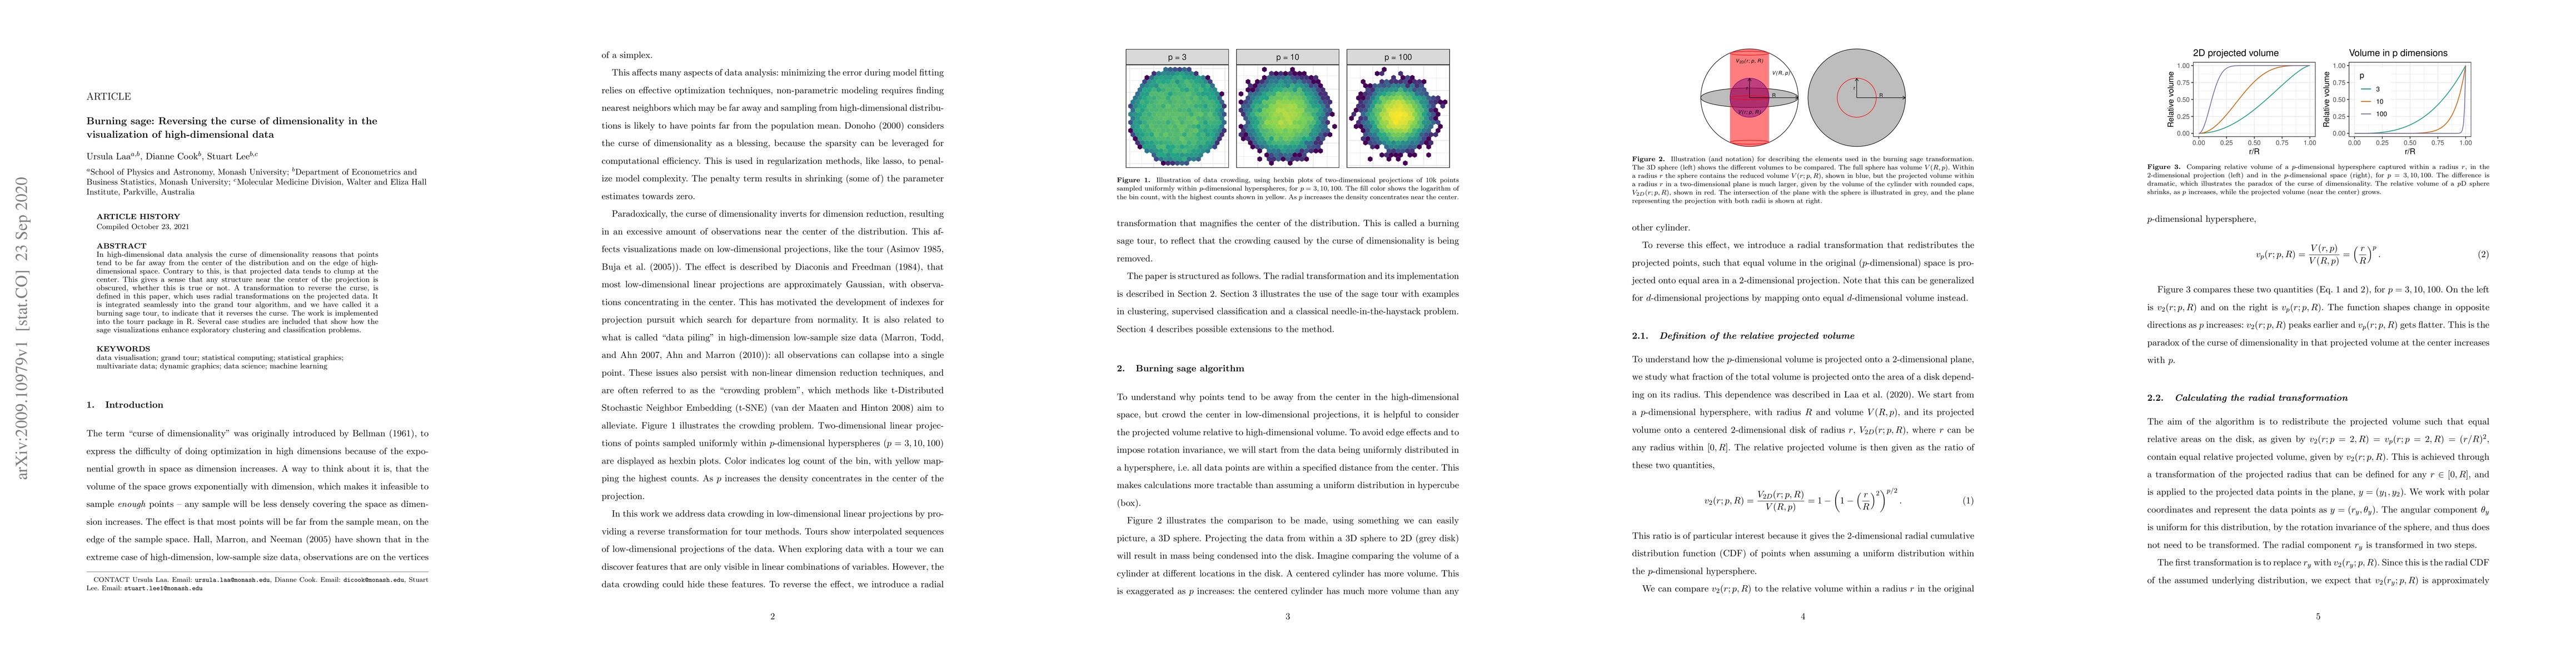
In high-dimensional data analysis the curse of dimensionality reasons that points tend to be far away from the center of the distribution and on the edge of high-dimensional space. Contrary to this, is that projected data tends to clump at the center. This gives a sense that any structure near the center of the projection is obscured, whether this is true or not. A transformation to reverse the curse, is defined in this paper, which uses radial transformations on the projected data. It is integrated seamlessly into the grand tour algorithm, and we have called it a burning sage tour, to indicate that it reverses the curse. The work is implemented into the tourr package in R. Several case studies are included that show how the sage visualizations enhance exploratory clustering and classification problems.
AI Key Findings
Get AI-generated insights about this paper's methodology, results, and significance.
Paper Details
PDF Preview
Key Terms
Citation Network
Current paper (gray), citations (green), references (blue)
Display is limited for performance on very large graphs.
Similar Papers
Found 4 papersCurse of Dimensionality on Persistence Diagrams
Enhao Liu, Yasuaki Hiraoka, Yusuke Imoto et al.
| Title | Authors | Year | Actions |
|---|
Comments (0)