BVI-UGC: A Video Quality Database for User-Generated Content Transcoding
Publication
Metrics
AI Quick Summary
The BVI-UGC database provides 60 non-pristine reference videos and 1,080 test sequences for evaluating user-generated content (UGC) video transcoding. A crowdsourced study involving over 3,500 participants benchmarked the performance of various quality metrics, revealing poor predictions (SROCC < 0.6) for UGC quality.
Paper Preview
Abstract
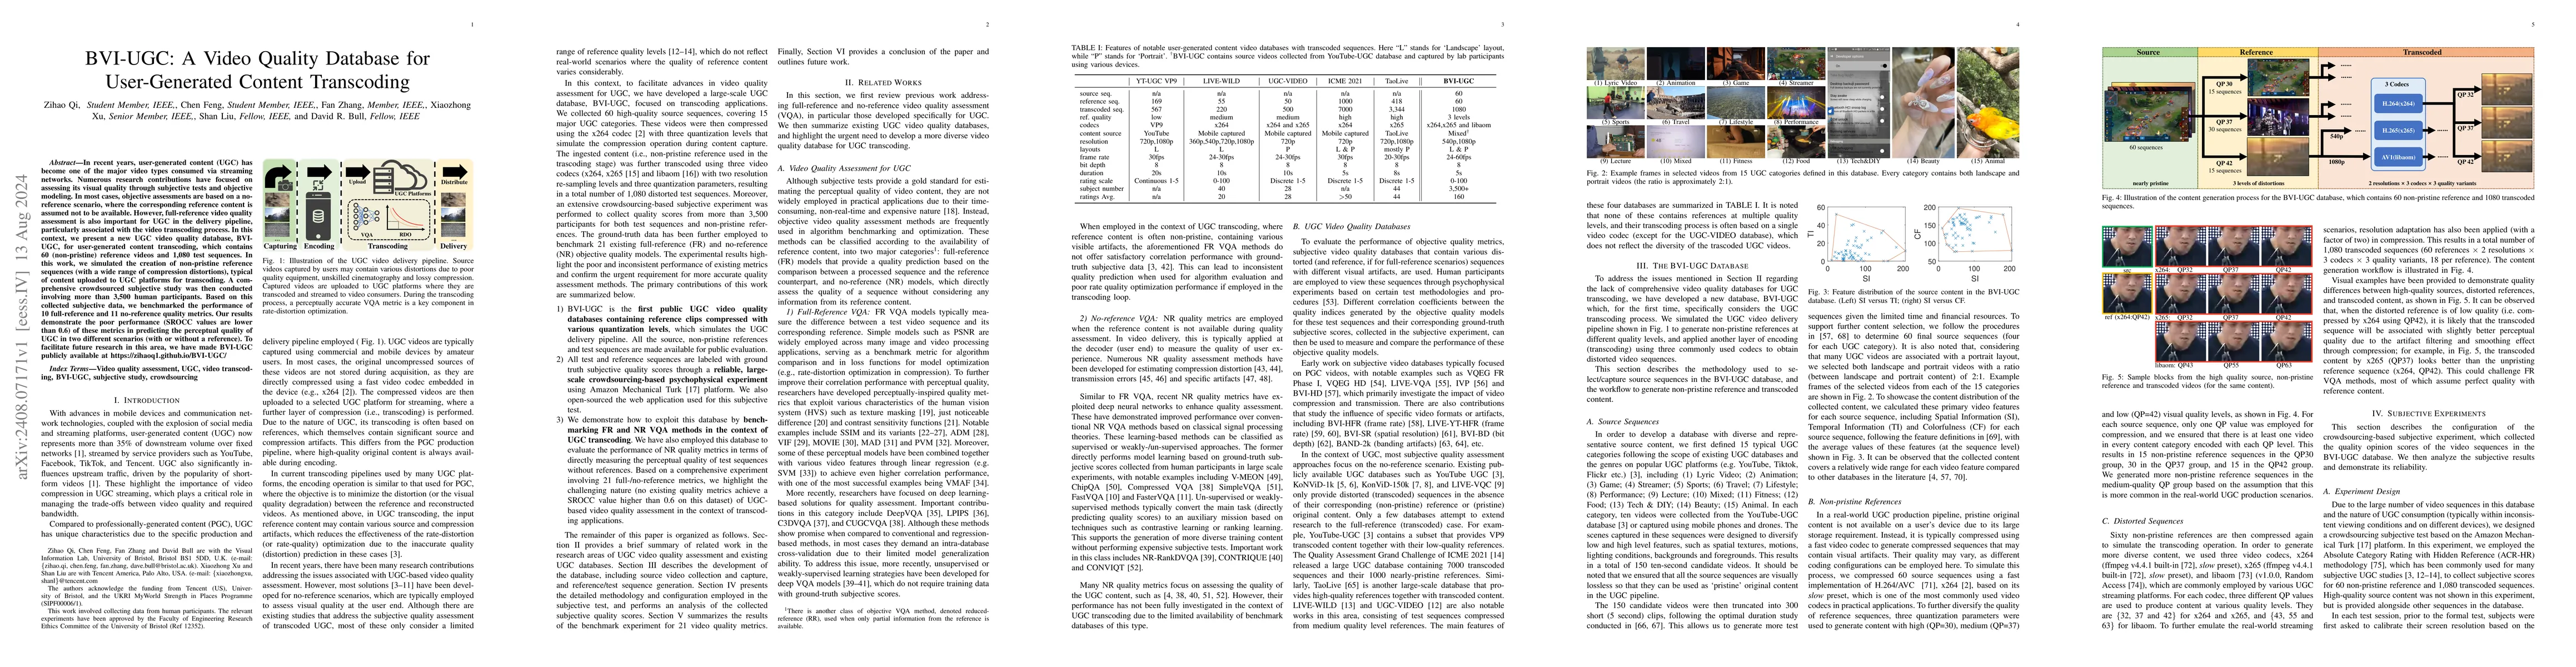
In recent years, user-generated content (UGC) has become one of the major video types consumed via streaming networks. Numerous research contributions have focused on assessing its visual quality through subjective tests and objective modeling. In most cases, objective assessments are based on a no-reference scenario, where the corresponding reference content is assumed not to be available. However, full-reference video quality assessment is also important for UGC in the delivery pipeline, particularly associated with the video transcoding process. In this context, we present a new UGC video quality database, BVI-UGC, for user-generated content transcoding, which contains 60 (non-pristine) reference videos and 1,080 test sequences. In this work, we simulated the creation of non-pristine reference sequences (with a wide range of compression distortions), typical of content uploaded to UGC platforms for transcoding. A comprehensive crowdsourced subjective study was then conducted involving more than 3,500 human participants. Based on this collected subjective data, we benchmarked the performance of 10 full-reference and 11 no-reference quality metrics. Our results demonstrate the poor performance (SROCC values are lower than 0.6) of these metrics in predicting the perceptual quality of UGC in two different scenarios (with or without a reference).
AI Key Findings
Get AI-generated insights about this paper's methodology, results, significance, and more — seven facets brought into focus.
Impact
Paper Details
Authors
PDF Preview
Key Terms
Citation Network
Current paper (gray), citations (green), references (blue)
Display is limited for performance on very large graphs.
Discussion 0