Authors
Summary
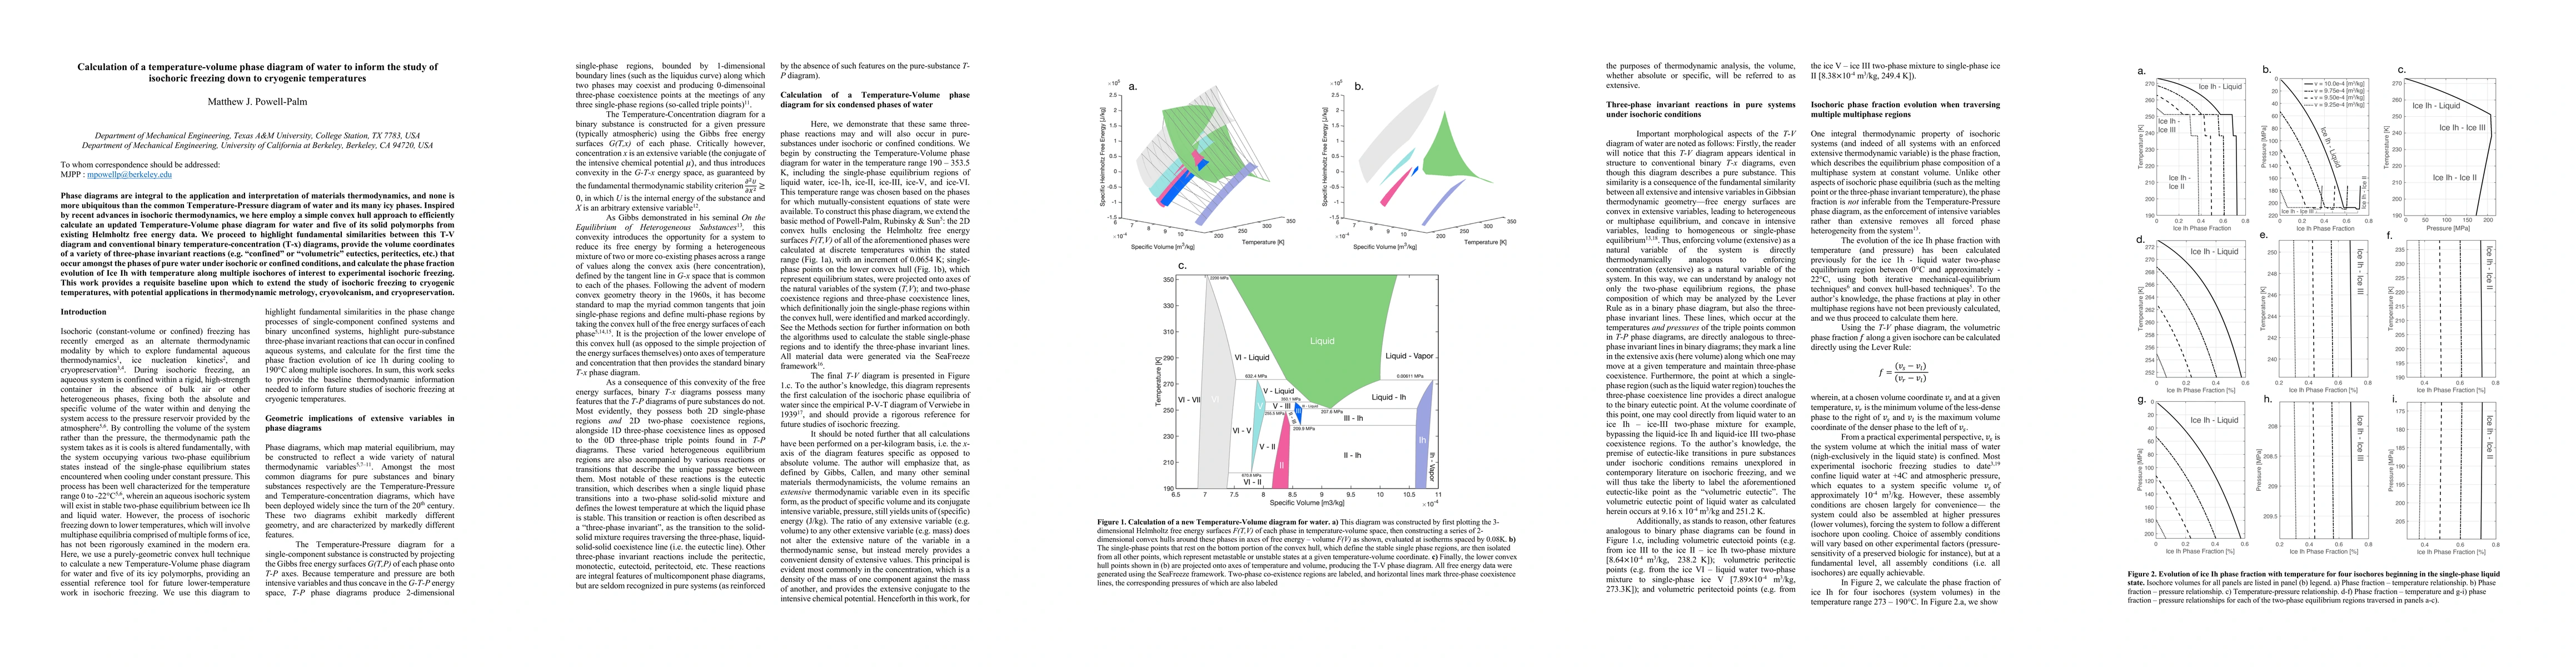
Phase diagrams are integral to the application and interpretation of materials thermodynamics, and none is more ubiquitous than the common Temperature-Pressure diagram of water and its many icy phases. Inspired by recent advances in isochoric thermodynamics, we here employ a simple convex hull approach to efficiently calculate an updated Temperature-Volume phase diagram for water and five of its solid polymorphs from existing Helmholtz free energy data. We proceed to highlight fundamental similarities between this T-V diagram and conventional binary temperature-concentration (T-x) diagrams, provide the volume coordinates of a variety of three-phase invariant reactions (e.g. 'confined' or 'volumetric' eutectics, peritectics, etc.) that occur amongst the phases of pure water under isochoric or confined conditions, and calculate the phase fraction evolution of Ice Ih with temperature along multiple isochores of interest to experimental isochoric freezing. This work provides a requisite baseline upon which to extend the study of isochoric freezing to cryogenic temperatures, with potential applications in thermodynamic metrology, cryovolcanism, and cryopreservation.
AI Key Findings
Get AI-generated insights about this paper's methodology, results, and significance.
Paper Details
PDF Preview
Key Terms
Citation Network
Current paper (gray), citations (green), references (blue)
Display is limited for performance on very large graphs.
Similar Papers
Found 4 papers| Title | Authors | Year | Actions |
|---|
Comments (0)