Calendar-based graphics for visualizing people's daily schedules
Publication
Metrics
AI Quick Summary
A new R package displays temporal data on a calendar layout to visualize daily schedules, allowing for easier analysis of pedestrian behavior patterns.
Paper Preview
Abstract
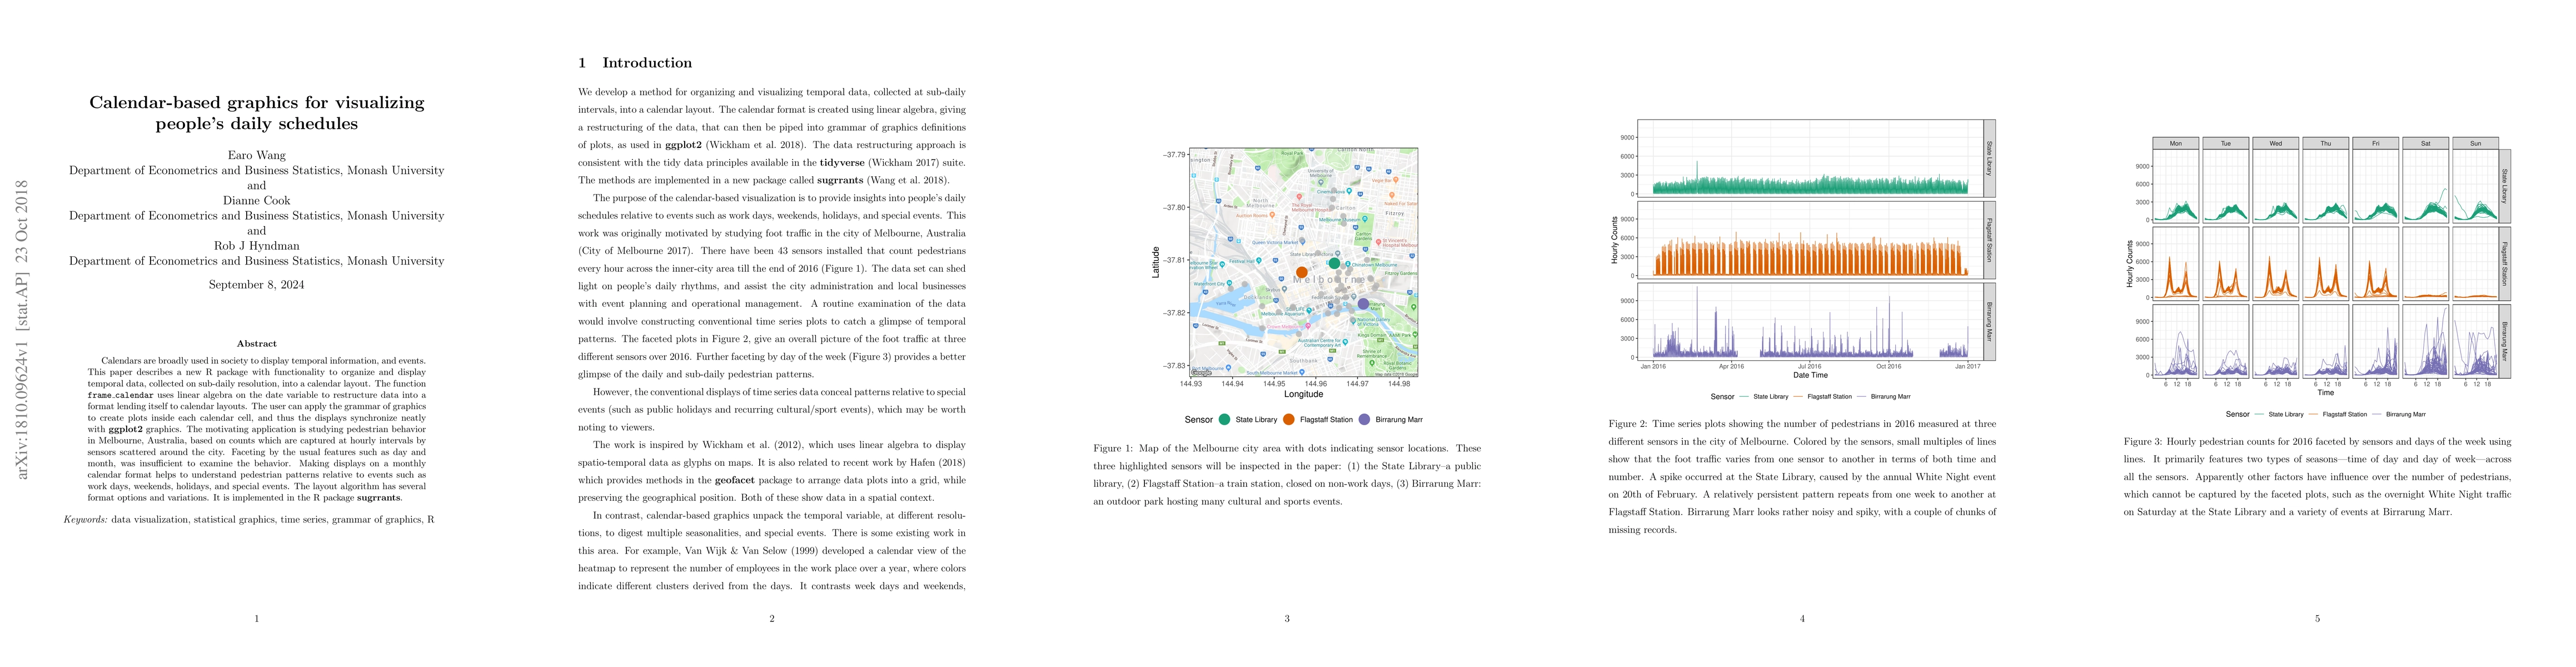
Calendars are broadly used in society to display temporal information, and events. This paper describes a new R package with functionality to organize and display temporal data, collected on sub-daily resolution, into a calendar layout. The function `frame_calendar` uses linear algebra on the date variable to restructure data into a format lending itself to calendar layouts. The user can apply the grammar of graphics to create plots inside each calendar cell, and thus the displays synchronize neatly with ggplot2 graphics. The motivating application is studying pedestrian behavior in Melbourne, Australia, based on counts which are captured at hourly intervals by sensors scattered around the city. Faceting by the usual features such as day and month, was insufficient to examine the behavior. Making displays on a monthly calendar format helps to understand pedestrian patterns relative to events such as work days, weekends, holidays, and special events. The layout algorithm has several format options and variations. It is implemented in the R package sugrrants.
AI Key Findings
Get AI-generated insights about this paper's methodology, results, significance, and more — seven facets brought into focus.
Impact
Paper Details
PDF Preview
Key Terms
Citation Network
Current paper (gray), citations (green), references (blue)
Display is limited for performance on very large graphs.
Discussion 0