Summary
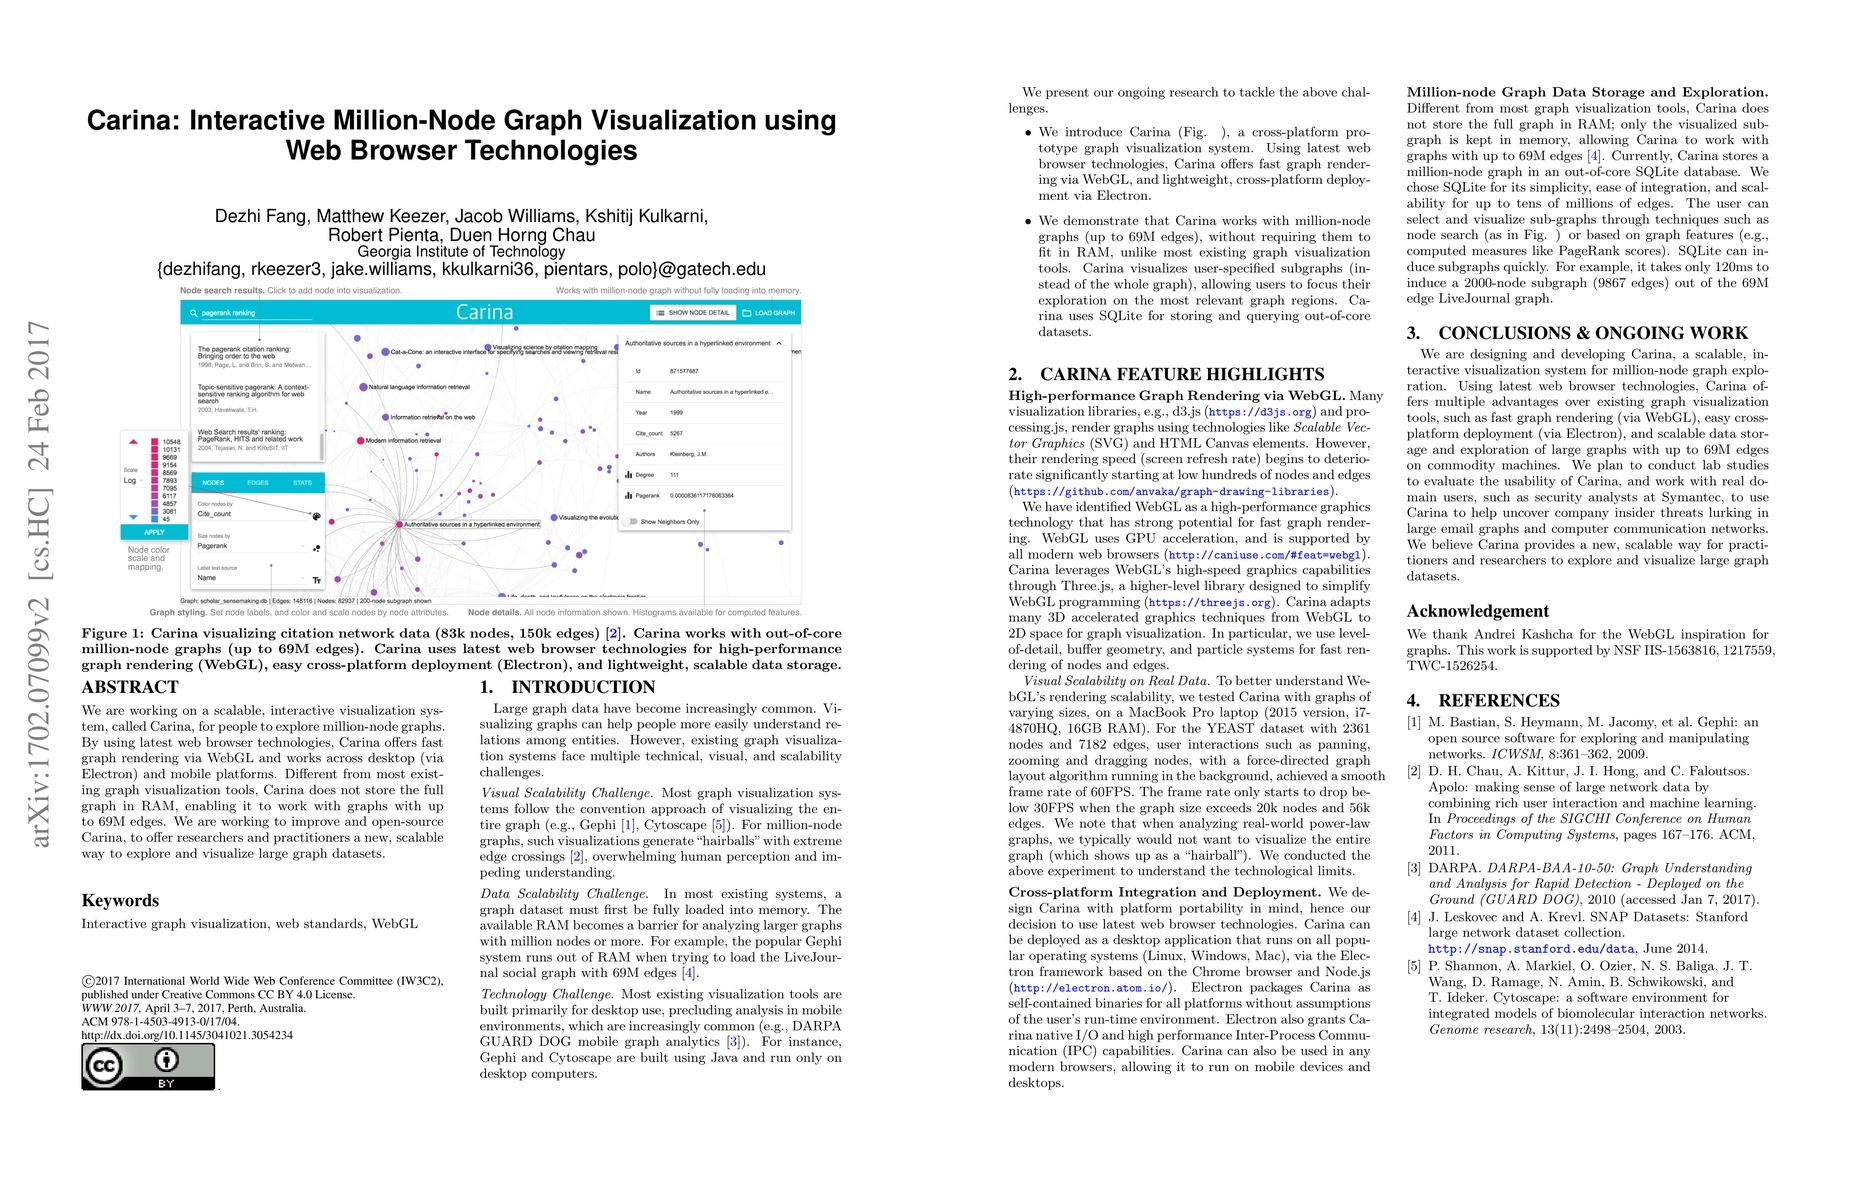
We are working on a scalable, interactive visualization system, called Carina, for people to explore million-node graphs. By using latest web browser technologies, Carina offers fast graph rendering via WebGL, and works across desktop (via Electron) and mobile platforms. Different from most existing graph visualization tools, Carina does not store the full graph in RAM, enabling it to work with graphs with up to 69M edges. We are working to improve and open-source Carina, to offer researchers and practitioners a new, scalable way to explore and visualize large graph datasets.
AI Key Findings
Generated Sep 03, 2025
Methodology
The research introduces Carina, a cross-platform prototype graph visualization system using the latest web browser technologies, including WebGL for high-performance rendering and Electron for cross-platform deployment.
Key Results
- Carina can visualize million-node graphs (up to 69M edges) without fully loading them into memory, unlike most existing graph visualization tools.
- Carina demonstrates smooth frame rates (60 FPS) for user interactions on graphs with sizes up to 20k nodes and 56k edges on a MacBook Pro laptop.
Significance
This research offers a scalable, interactive way for researchers and practitioners to explore and visualize large graph datasets, addressing visual scalability, data scalability, and technology challenges faced by existing graph visualization systems.
Technical Contribution
Carina leverages WebGL's high-speed graphics capabilities through Three.js for fast rendering of nodes and edges, and uses SQLite for storing and querying out-of-core datasets, enabling scalable data storage and exploration of large graphs on commodity machines.
Novelty
Carina's novelty lies in its approach to visualizing million-node graphs without fully loading them into memory, its use of modern web technologies for high-performance rendering and cross-platform deployment, and its ability to work with graphs containing up to 69M edges.
Limitations
- The paper does not discuss limitations explicitly, but potential limitations could include performance on even larger graphs or specific feature support for certain types of graph analysis.
Future Work
- The authors plan to conduct lab studies to evaluate Carina's usability and work with real-domain users, such as security analysts at Symantec, to uncover threats in large email graphs and computer communication networks.
- Further improvements and open-sourcing of Carina are intended to enhance its capabilities and accessibility.
Paper Details
PDF Preview
Key Terms
Citation Network
Current paper (gray), citations (green), references (blue)
Display is limited for performance on very large graphs.
Similar Papers
Found 4 papers| Title | Authors | Year | Actions |
|---|

Comments (0)