ArxivLens

Quick Summary:

CARTOLABE is a web-based system for visualizing and exploring large document collections by topic, featuring a scalable multi-scale interface for interactive data analysis. It includes NLP-driven modules for multidimensional projection and UMAP visualization, enabling non-experts to navigate and query extensive corpora.

arXiv Id: 2003.00975
Date Published: 2020-10-20
Date Updated: 2020-10-20

Categories:

Key Terms (TF-IDF):

corpus (0.298)
projection (0.222)
textual (0.216)
entries (0.206)
web (0.196)
filtering (0.189)
exploring (0.187)
module (0.169)
regions (0.143)
plane (0.142)
national (0.126)
multidimensional (0.125)
documents (0.124)
multi scale (0.123)
bring (0.123)
evolved (0.122)
language processing (0.122)
entities (0.120)
meaningful (0.120)
topics (0.117)
License: http://arxiv.org/licenses/nonexclusive-distrib/1.0/

Summary:

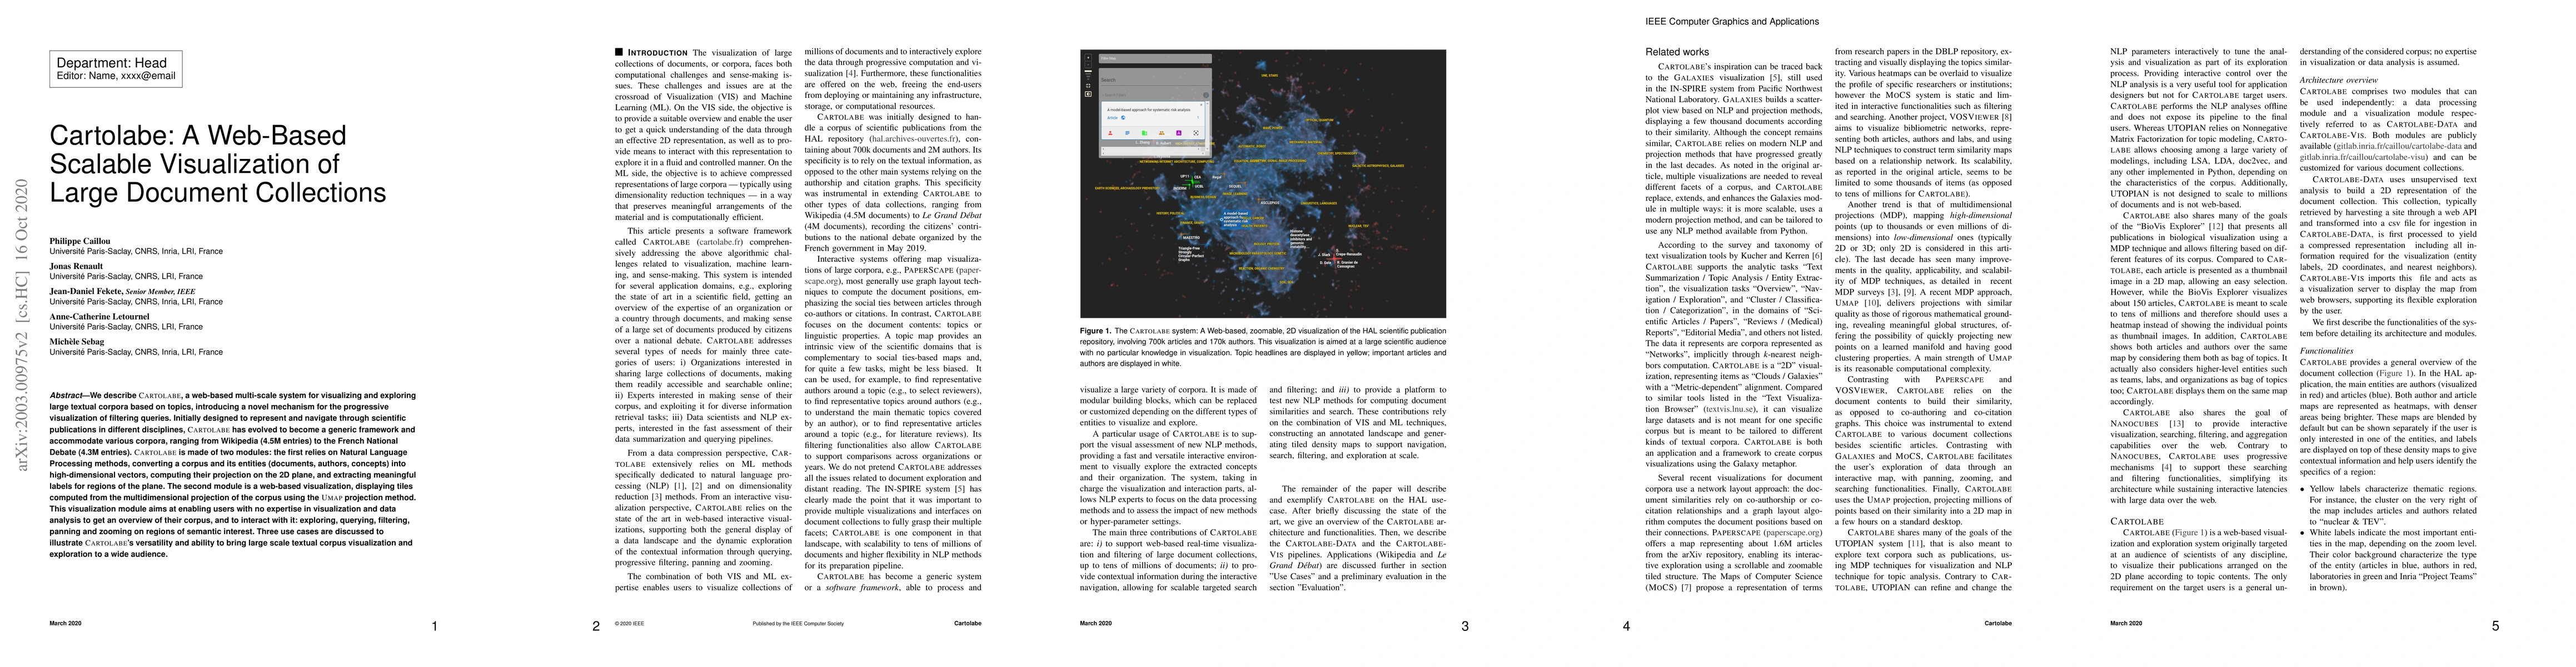
We describe CARTOLABE, a web-based multi-scale system for visualizing and exploring large textual corpora based on topics, introducing a novel mechanism for the progressive visualization of filtering queries. Initially designed to represent and navigate through scientific publications in different disciplines, CARTOLABE has evolved to become a generic framework and accommodate various corpora, ranging from Wikipedia (4.5M entries) to the French National Debate (4.3M entries). CARTOLABE is made of two modules: the first relies on Natural Language Processing methods, converting a corpus and its entities (documents, authors, concepts) into high-dimensional vectors, computing their projection on the 2D plane, and extracting meaningful labels for regions of the plane. The second module is a web-based visualization, displaying tiles computed from the multidimensional projection of the corpus using the U MAP projection method. This visualization module aims at enabling users with no expertise in visualization and data analysis to get an overview of their corpus, and to interact with it: exploring, querying, filtering, panning and zooming on regions of semantic interest. Three use cases are discussed to illustrate CARTOLABE's versatility and ability to bring large scale textual corpus visualization and exploration to a wide audience.

Citation & Reference Network Visualization

This graph shows how this paper is connected to other research. The current paper is shown in dark gray, papers that cite it are in green, and papers it references are in blue. You can:

Current Paper
Papers citing this work (Citations)
Papers cited by this work (References)

• Hover over any node to see the paper title

• Click a node to view that paper's details

• Drag nodes to rearrange the graph

• Use the zoom controls (bottom right) to zoom in/out

Citations and References

Title Authors Year Actions
Enhancing Text Corpus Exploration with Post Hoc Explanations and Comparative Design
Michael Gleicher, Keaton Leppenan, Yunyu Bai
2024
View Paper
A Hybrid Intelligence Method for Argument Mining
Michiel van der Meer, Enrico Liscio, C. Jonker, A. Plaat, Piek T. J. M. Vossen, P. Murukannaiah
2024
View Paper
HINTs: Sensemaking on large collections of documents with Hypergraph visualization and INTelligent agents
Sam Yu-Te Lee, Kwan-Liu Ma
2024
View Paper
MapIntel: A visual analytics platform for competitive intelligence
David Silva, F. Bação
2023
View Paper
Improving Dimensionality Reduction Projections for Data Visualization
Bardia Rafieian, P. Hermosilla, Pere-Pau Vázquez
2023
View Paper
Large-Scale Evaluation of Topic Models and Dimensionality Reduction Methods for 2D Text Spatialization
Daniel Atzberger, Tim Cech, Willy Scheibel, Matthias Trapp, R. Richter, J. Dollner, Tobias Schreck
2023
View Paper
An Interdisciplinary Perspective on Evaluation and Experimental Design for Visual Text Analytics: Position Paper
Kostiantyn Kucher, N. Sultanum, Angel Daza, Vasiliki Simaki, Maria Skeppstedt, Barbara Plank, Jean-Daniel Fekete, Narges Mahyar
2022
View Paper
A Benchmark for the Use of Topic Models for Text Visualization Tasks
Daniel Atzberger, Tim Cech, Willy Scheibel, Daniel Limberger, Matthias Trapp, J. Döllner
2022
View Paper
Kyrix-S: Authoring Scalable Scatterplot Visualizations of Big Data
Wenbo Tao, Xinli Hou, Adam Sah, L. Battle, Remco Chang, M. Stonebraker
2020
View Paper
Activity report
Journal Manager Jffn
2019
View Paper
MapIntel: Enhancing Competitive Intelligence Acquisition Through Embeddings and Visual Analytics
David Silva, F. Bação
2022
View Paper
KDBI special issue: MapIntel: A Visual Analytics Platform for Competitive Intelligence
David Silva, Fernando Bacao, Fernando Ba¸c˜ao
View Paper

Comments (0)

This website uses cookies to ensure you get the best experience. Learn more