Publication
Metrics
Paper Preview
Abstract
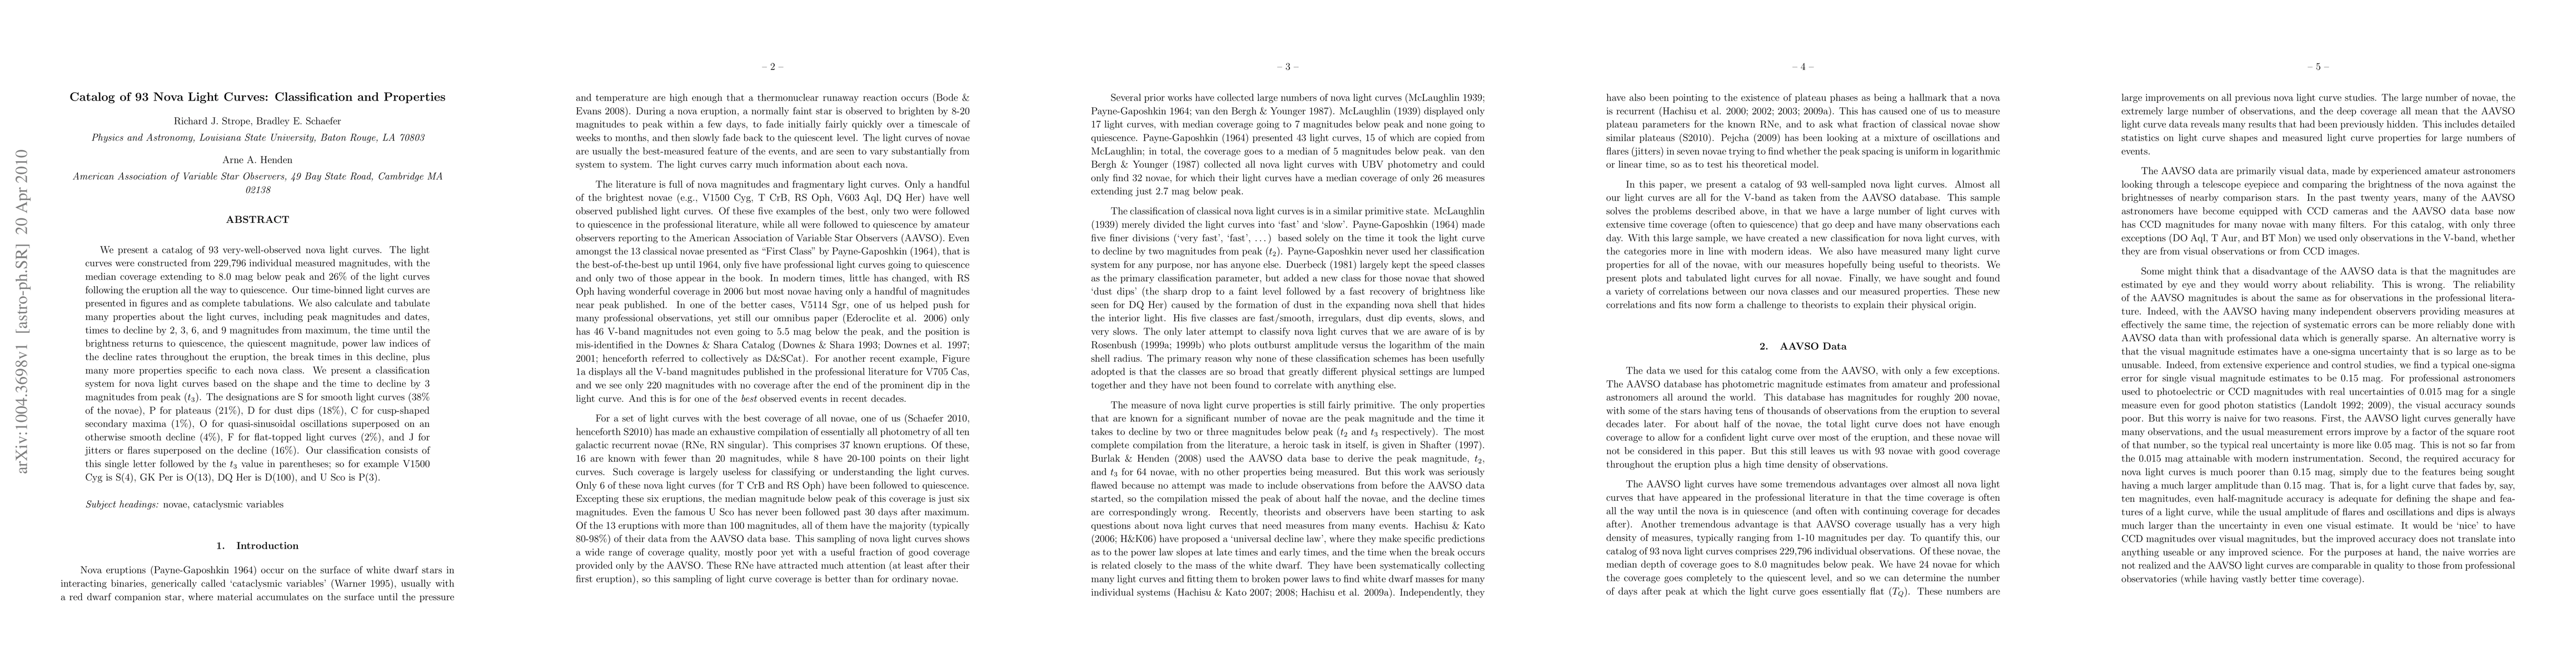
We present a catalog of 93 very-well-observed nova light curves. The light curves were constructed from 229,796 individual measured magnitudes, with the median coverage extending to 8.0 mag below peak and 26% of the light curves following the eruption all the way to quiescence. Our time-binned light curves are presented in figures and as complete tabulations. We also calculate and tabulate many properties about the light curves, including peak magnitudes and dates, times to decline by 2, 3, 6, and 9 magnitudes from maximum, the time until the brightness returns to quiescence, the quiescent magnitude, power law indices of the decline rates throughout the eruption, the break times in this decline, plus many more properties specific to each nova class. We present a classification system for nova light curves based on the shape and the time to decline by 3 magnitudes from peak (t3). The designations are S for smooth light curves (38% of the novae), P for plateaus (21%), D for dust dips (18%), C for cusp-shaped secondary maxima (1%), O for quasi-sinusoidal oscillations superposed on an otherwise smooth decline (4%), F for flat-topped light curves (2%), and J for jitters or flares superposed on the decline (16%). Our classification consists of this single letter followed by the t3 value in parentheses; so for example V1500 Cyg is S(4), GK Per is O(13), DQ Her is D(100), and U Sco is P(3).
AI Key Findings
Get AI-generated insights about this paper's methodology, results, significance, and more — seven facets brought into focus.
Impact
Paper Details
PDF Preview
Key Terms
Citation Network
Current paper (gray), citations (green), references (blue)
Display is limited for performance on very large graphs.
Discussion 0