Publication
Metrics
AI Quick Summary
This paper introduces a novel method for categorizing radio frequency interference (RFI) using Principal Component Analysis and Fourier analysis, achieving high F1 scores. The classifier identifies different types of RFI, revealing new insights into RFI sources and its impact on pulsar searches.
Paper Preview
Abstract
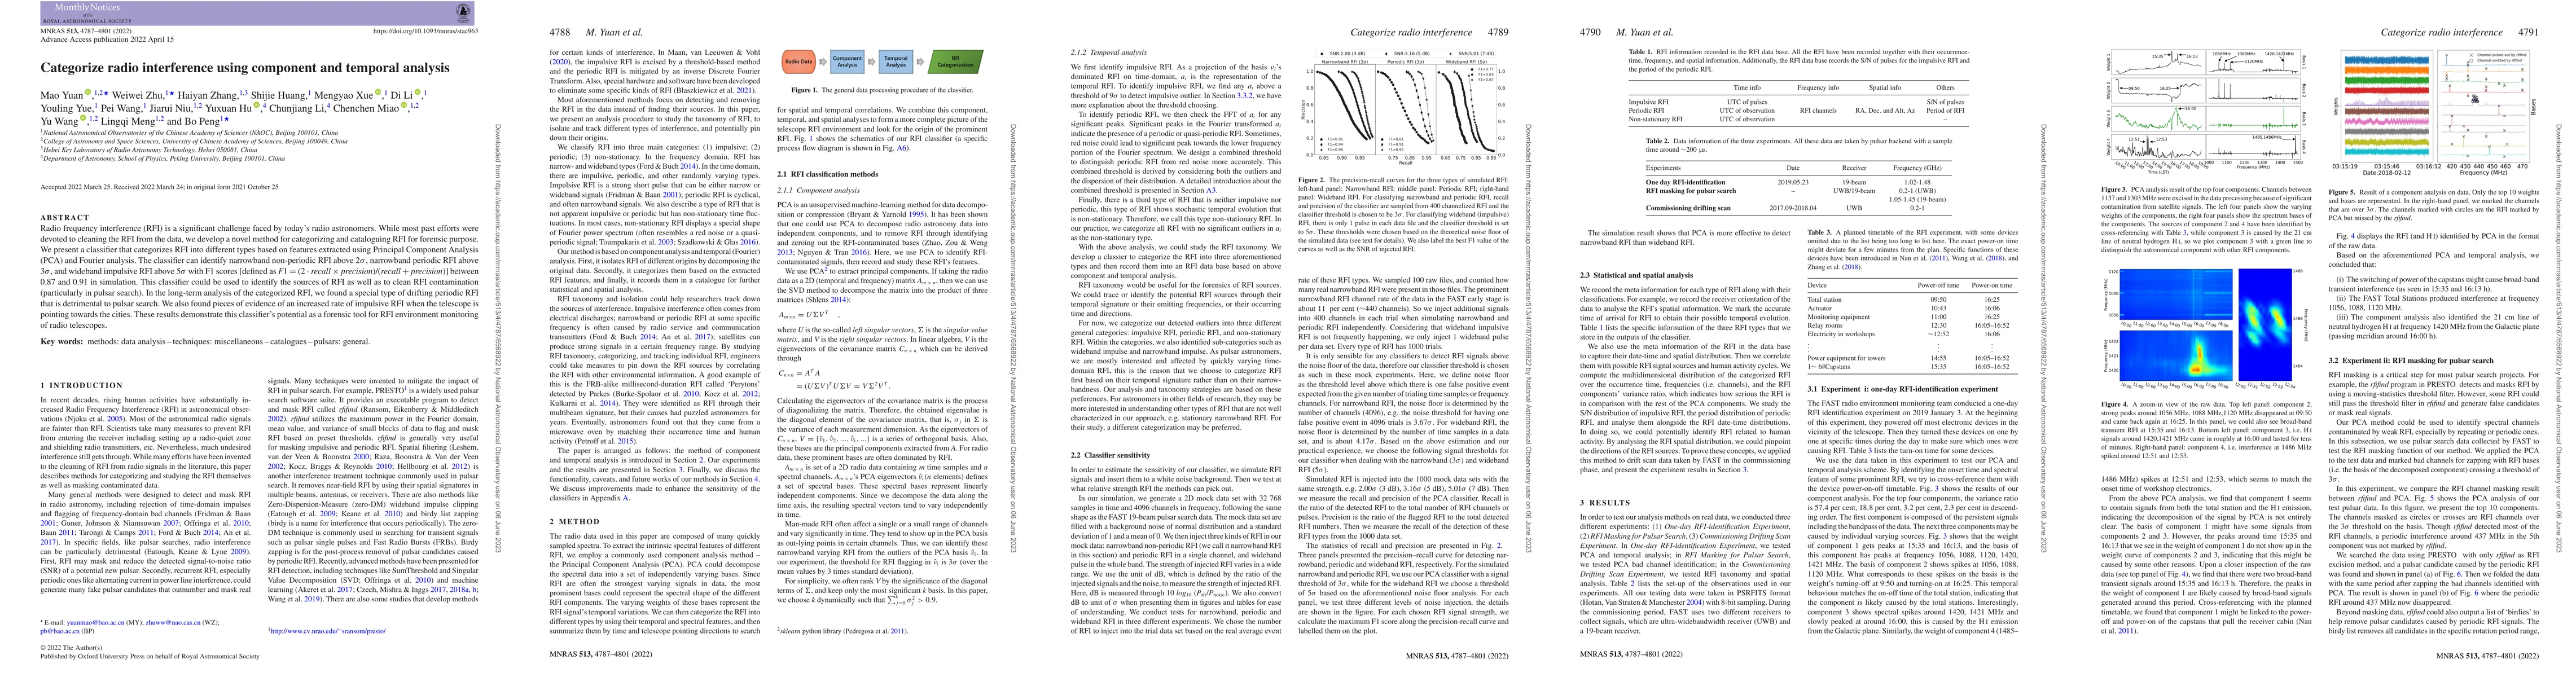
Radio frequency interference (RFI) is a significant challenge faced by today's radio astronomers. While most past efforts were devoted to cleaning the RFI from the data, we develop a novel method for categorizing and cataloguing RFI for forensic purpose. We present a classifier that categorizes RFI into different types based on features extracted using Principal Component Analysis (PCA) and Fourier analysis. The classifier can identify narrowband non-periodic RFI above 2 sigma, narrowband periodic RFI above 3 sigma, and wideband impulsive RFI above 5 sigma with F1 scores between 0.87 and 0.91 in simulation. This classifier could be used to identify the sources of RFI as well as to clean RFI contamination (particularly in pulsar search). In the long-term analysis of the categorized RFI, we found a special type of drifting periodic RFI that is detrimental to pulsar search. We also found evidences of an increased rate of impulsive RFI when the telescope is pointing toward the cities. These results demonstrate this classifier's potential as a forensic tool for RFI environment monitoring of radio telescopes.
AI Key Findings
Get AI-generated insights about this paper's methodology, results, significance, and more — seven facets brought into focus.
Impact
Paper Details
Authors
PDF Preview
Key Terms
Citation Network
Current paper (gray), citations (green), references (blue)
Display is limited for performance on very large graphs.
Discussion 0