Publication
Metrics
AI Quick Summary
This paper introduces causal diagrams, specifically directed acyclic graphs (DAGs), to civil engineers to better understand complex causal relationships. Case studies show that engineers can use these diagrams to identify confounders, colliders, and mediators, thereby enhancing their research and practical problem-solving.
Paper Preview
Abstract
Causal diagrams are logic and graphical tools that depict assumptions about presumed causal relations. Such diagrams have proven effective in tackling a variety of problems in social sciences and epidemiology research yet remain foreign to civil engineers. Unlike the traditional means of examining relationships via multivariable regression, causal diagrams can identify the presence of confounders, colliders, and mediators. Thus, this paper hopes to introduce the big ideas behind causal diagrams (specifically, directed acyclic graphs (DAGs)) and how to create and apply such diagrams to several civil engineering problems. Findings from the presented case studies indicate that civil engineers can successfully use causal diagrams to improve their understanding of complex causation relations, thereby accelerating research and practical efforts.
AI Key Findings
Get AI-generated insights about this paper's methodology, results, significance, and more — seven facets brought into focus.
Impact
Paper Details
Authors
PDF Preview
Key Terms
Citation Network
Current paper (gray), citations (green), references (blue)
Display is limited for performance on very large graphs.
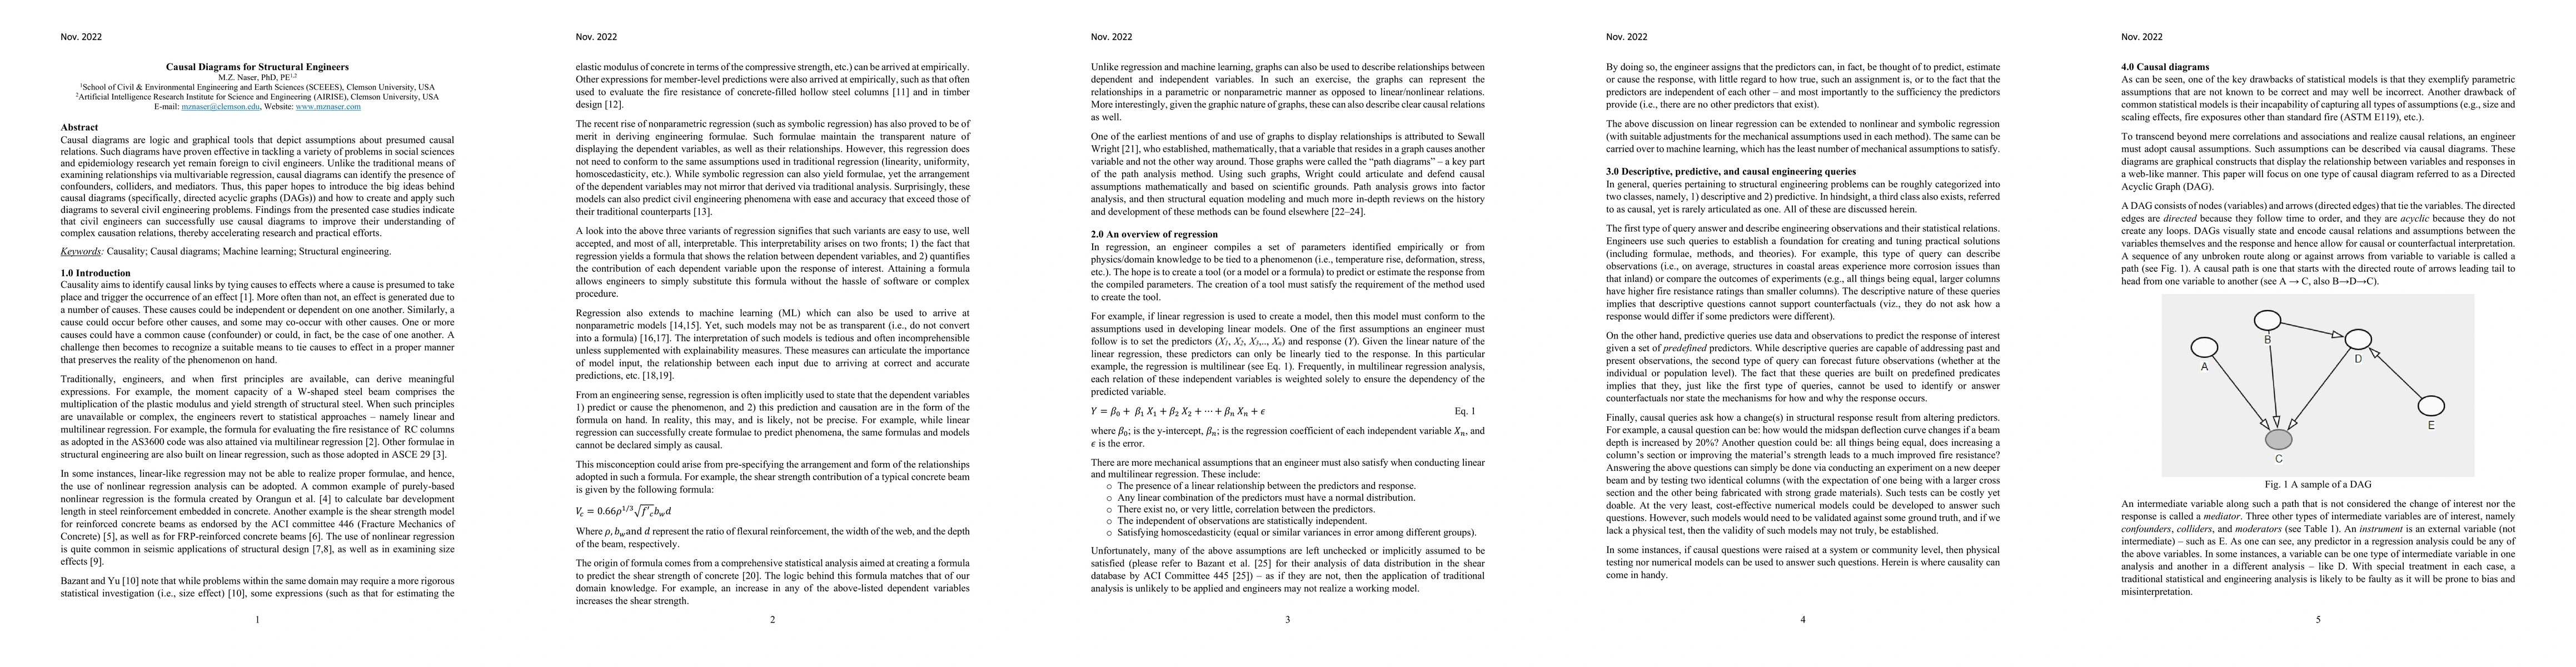
Discussion 0