01
MethodologyHow they did it
Brief description of the research methodology used
The study analyzes US economic sectors from 2000-2008, revealing a 1.5-year recovery from the 1998-2003 crisis and a 2-month plunge into the 2007-2008 crisis. Oil & gas, and basic materials led post-crisis recovery, while consumer goods and utilities signaled the 2007-2008 crisis. Sectors entering crisis earlier exited later, with leading sectors experiencing stronger volatility shocks. Causal link analysis showed shorter delays between shocks in related sectors. The research also found nonlinear amplification in volatility shocks and evidence of endogenous sectorial dynamics during the 2003 recovery, contrasting with exogenous Federal Reserve rate cuts in 2007. Interestingly, some 2007/2008 rate cuts initially reduced volatilities but later increased them.
The study analyzes US economic sectors from 2000-2008, revealing a 1.5-year recovery from the 1998-2003 crisis and a 2-month plunge into the 2007-2008 crisis. Oil & gas, and basic materials led post-crisis recovery, while consumer goods and utilities signaled the 2007-2008 crisis. Sectors entering crisis earlier exited later, with leading sectors experiencing stronger volatility shocks. Causal link analysis showed shorter delays between shocks in related sectors. The research also found nonlinear amplification in volatility shocks and evidence of endogenous sectorial dynamics during the 2003 recovery, contrasting with exogenous Federal Reserve rate cuts in 2007. Interestingly, some 2007/2008 rate cuts initially reduced volatilities but later increased them.
Brief description of the research methodology used More in Methodology →
Main finding 1 — Main finding 2 More in Key Results →
Why this research is important and its potential impact More in Significance →
Limitation 1 — Limitation 2 More in Limitations →
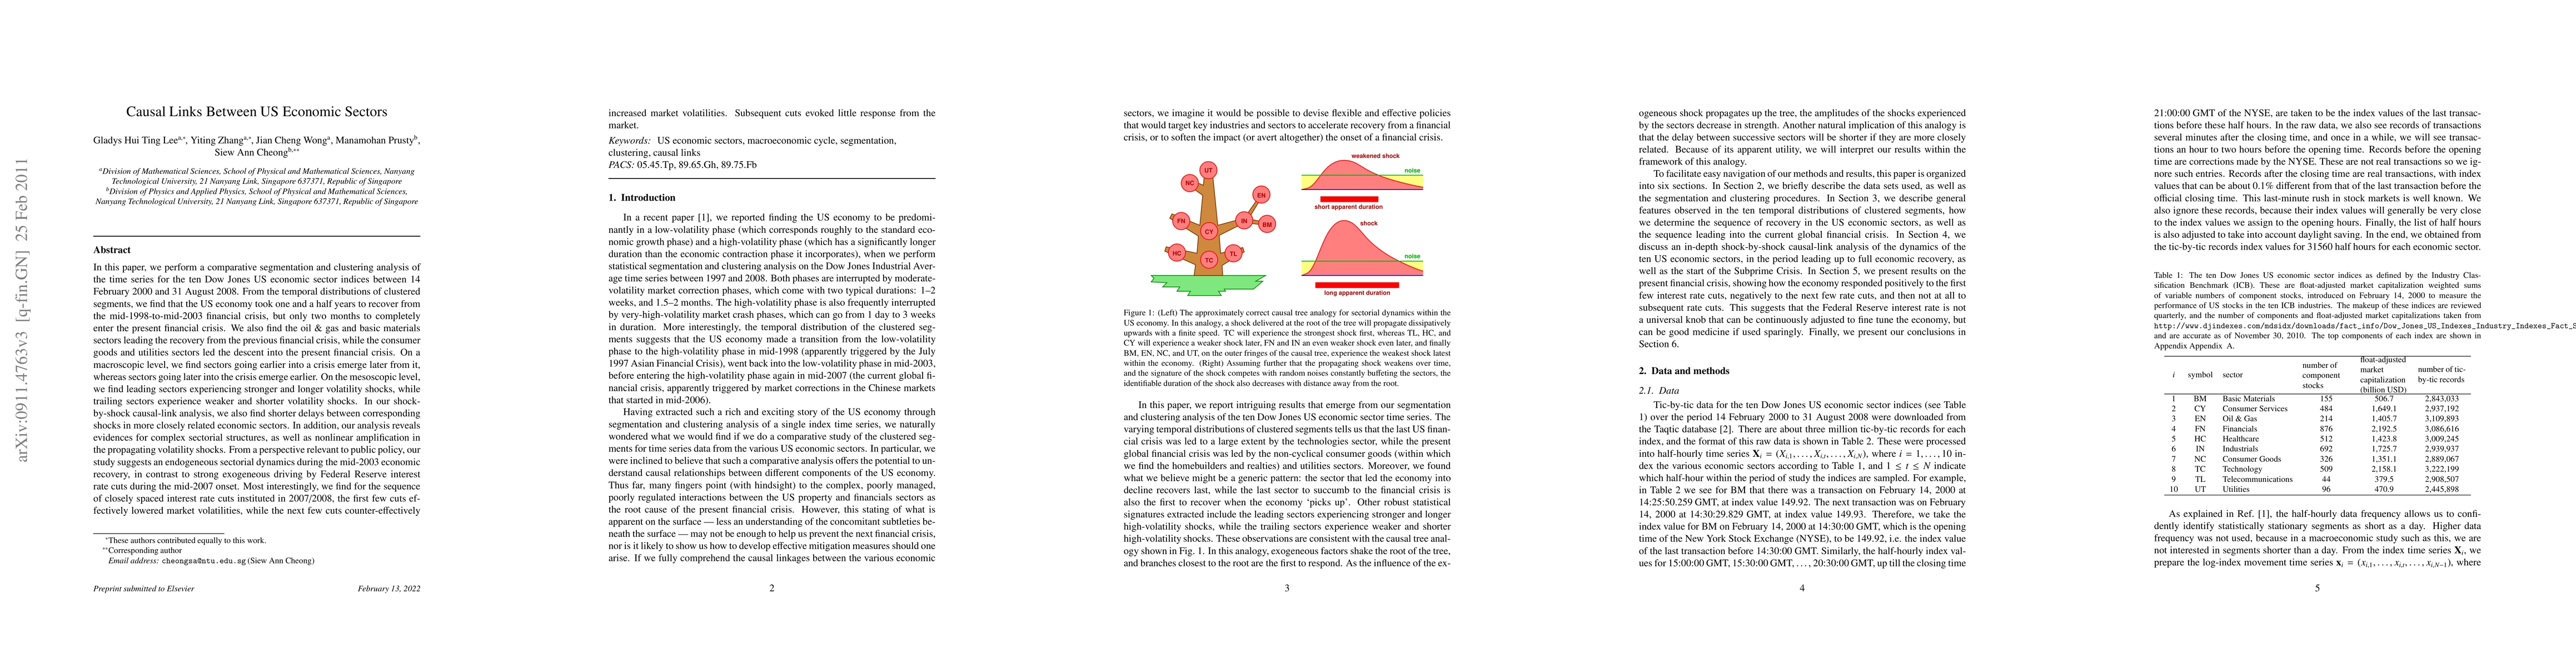
In this paper, we perform a comparative segmentation and clustering analysis of the time series for the ten Dow Jones US economic sector indices between 14 February 2000 and 31 August 2008. From the temporal distributions of clustered segments, we find that the US economy took one and a half years to recover from the mid-1998-to-mid-2003 financial crisis, but only two months to completely enter the present financial crisis. We also find the oil & gas and basic materials sectors leading the recovery from the previous financial crisis, while the consumer goods and utilities sectors led the descent into the present financial crisis. On a macroscopic level, we find sectors going earlier into a crisis emerge later from it, whereas sectors going later into the crisis emerge earlier. On the mesoscopic level, we find leading sectors experiencing stronger and longer volatility shocks, while trailing sectors experience weaker and shorter volatility shocks. In our shock-by-shock causal-link analysis, we also find shorter delays between corresponding shocks in more closely related economic sectors. In addition, our analysis reveals evidences for complex sectorial structures, as well as nonlinear amplification in the propagating volatility shocks. From a perspective relevant to public policy, our study suggests an endogeneous sectorial dynamics during the mid-2003 economic recovery, in contrast to strong exogeneous driving by Federal Reserve interest rate cuts during the mid-2007 onset. Most interestingly, we find for the sequence of closely spaced interest rate cuts instituted in 2007/2008, the first few cuts effectively lowered market volatilities, while the next few cuts counter-effectively increased market volatilities. Subsequent cuts evoked little response from the market.
Seven facets of this paper, analysed and brought into focus by AI.
Why this research is important and its potential impact
Brief description of the research methodology used
Why this research is important and its potential impact
Main technical or theoretical contribution
What makes this work novel or different from existing research
Current paper (gray), citations (green), references (blue)
Display is limited for performance on very large graphs.
Discussion 0