Causal quartets: Different ways to attain the same average treatment effect
Publication
Metrics
AI Quick Summary
This paper explores the concept of causal quartets, illustrating how different patterns of heterogeneity can lead to the same average treatment effect, akin to the complexity shown in Anscombe's correlation quartet. It highlights the nuanced ways real-world data can differ despite identical average outcomes.
Paper Preview
Abstract
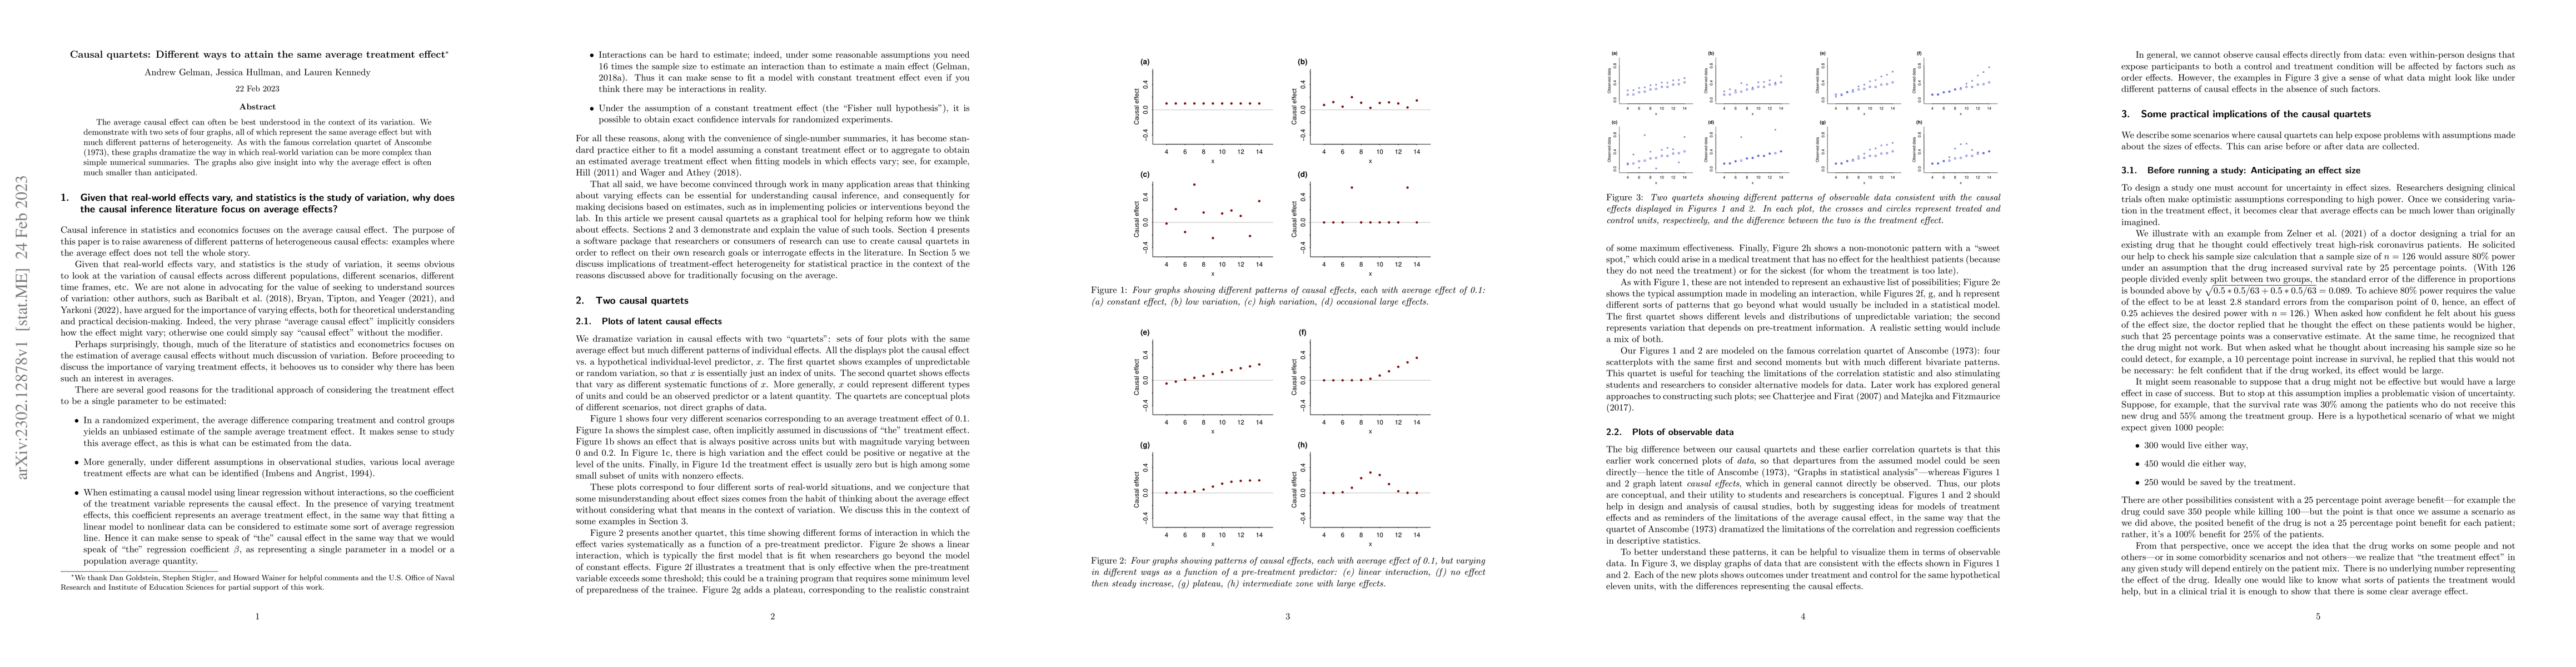
The average causal effect can often be best understood in the context of its variation. We demonstrate with two sets of four graphs, all of which represent the same average effect but with much different patterns of heterogeneity. As with the famous correlation quartet of Anscombe (1973), these graphs dramatize the way in which real-world variation can be more complex than simple numerical summaries. The graphs also give insight into why the average effect is often much smaller than anticipated.
AI Key Findings
Get AI-generated insights about this paper's methodology, results, significance, and more — seven facets brought into focus.
Impact
Paper Details
Authors
PDF Preview
Key Terms
Citation Network
Current paper (gray), citations (green), references (blue)
Display is limited for performance on very large graphs.
Discussion 0