Publication
Metrics
Paper Preview
Abstract
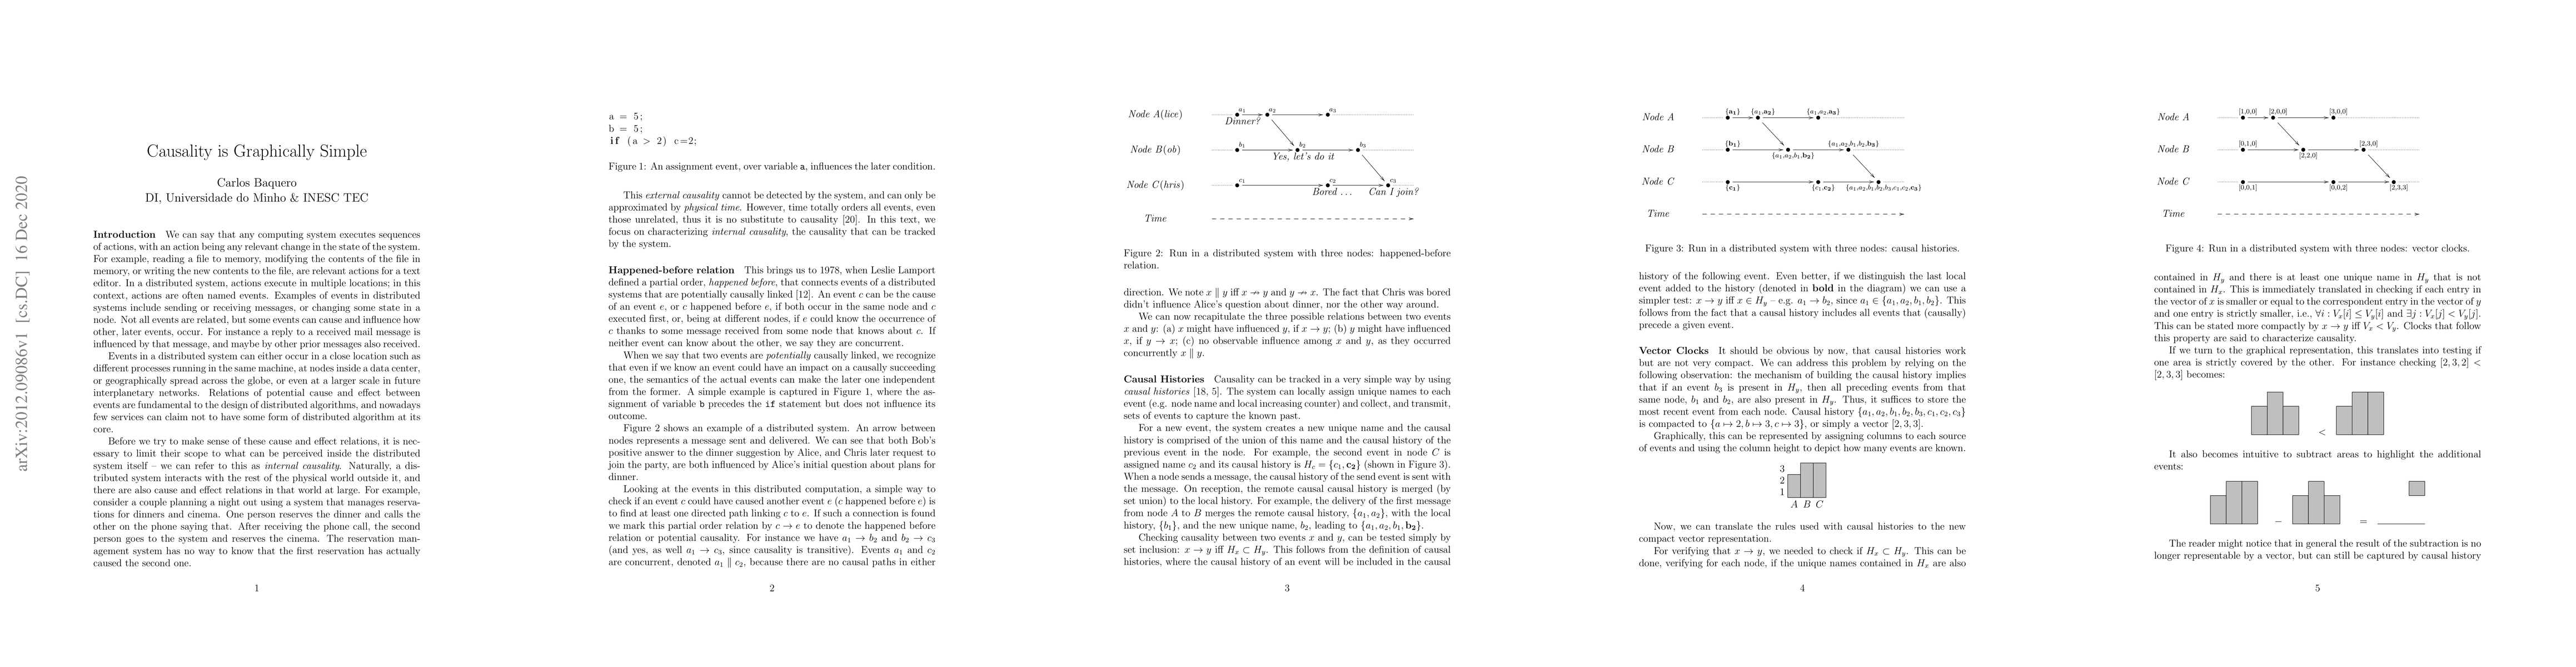
Events in distributed systems include sending or receiving messages, or changing some state in a node. Not all events are related, but some events can cause and influence how other, later events, occur. For instance, a reply to a received mail message is influenced by that message, and maybe by other prior messages also received. This article brings an introduction to classic causality tracking mechanisms and covers some more recent developments. The presentation is supported by a new graphical notation that allows an intuitive interpretation of the causality relations described.
AI Key Findings
Get AI-generated insights about this paper's methodology, results, significance, and more — seven facets brought into focus.
Impact
Paper Details
Authors
PDF Preview
Key Terms
Citation Network
Current paper (gray), citations (green), references (blue)
Display is limited for performance on very large graphs.
Discussion 0