Publication
Metrics
AI Quick Summary
The paper introduces cgmquantify, open-source Python and R packages designed to analyze continuous glucose monitor (CGM) data, offering over 20 validated metrics for glucose and variability. These tools aim to address the lack of standardization and validation in CGM data analysis, providing researchers and clinicians with enhanced insights into glucose patterns.
Paper Preview
Abstract
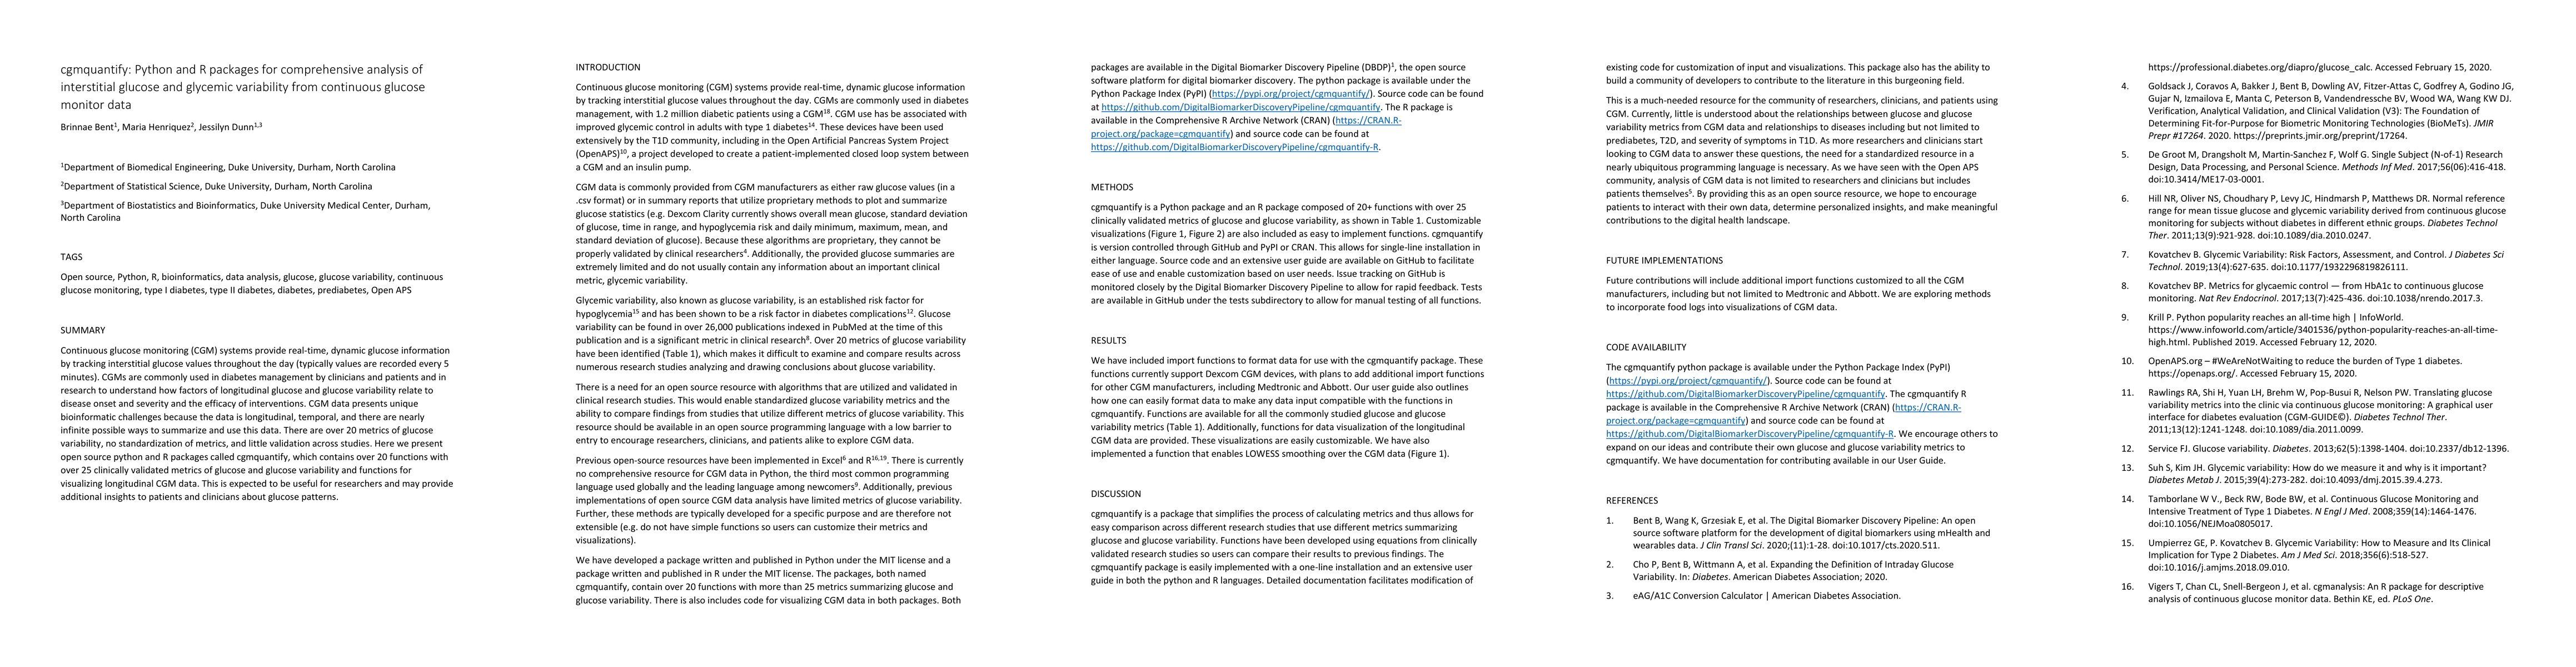
Continuous glucose monitoring (CGM) systems provide real-time, dynamic glucose information by tracking interstitial glucose values throughout the day (typically values are recorded every 5 minutes). CGMs are commonly used in diabetes management by clinicians and patients and in research to understand how factors of longitudinal glucose and glucose variability relate to disease onset and severity and the efficacy of interventions. CGM data presents unique bioinformatic challenges because the data is longitudinal, temporal, and there are nearly infinite possible ways to summarize and use this data. There are over 20 metrics of glucose variability, no standardization of metrics, and little validation across studies. Here we present open source python and R packages called cgmquantify, which contains over 20 functions with over 25 clinically validated metrics of glucose and glucose variability and functions for visualizing longitudinal CGM data. This is expected to be useful for researchers and may provide additional insights to patients and clinicians about glucose patterns.
AI Key Findings
Get AI-generated insights about this paper's methodology, results, significance, and more — seven facets brought into focus.
Impact
Paper Details
Authors
PDF Preview
Key Terms
Citation Network
Current paper (gray), citations (green), references (blue)
Display is limited for performance on very large graphs.
Discussion 0