Challenges in explaining deep learning models for data with biological variation
Publication
Metrics
AI Quick Summary
This research examines challenges in applying and explaining deep learning models to biological data, specifically grain data, for detecting diseases and damages. It highlights difficulties in evaluating and visualizing explanations due to variability in biological data and lack of clear "ground truth," aiming to identify robust and effective explainability methods for this domain.
Paper Preview
Abstract
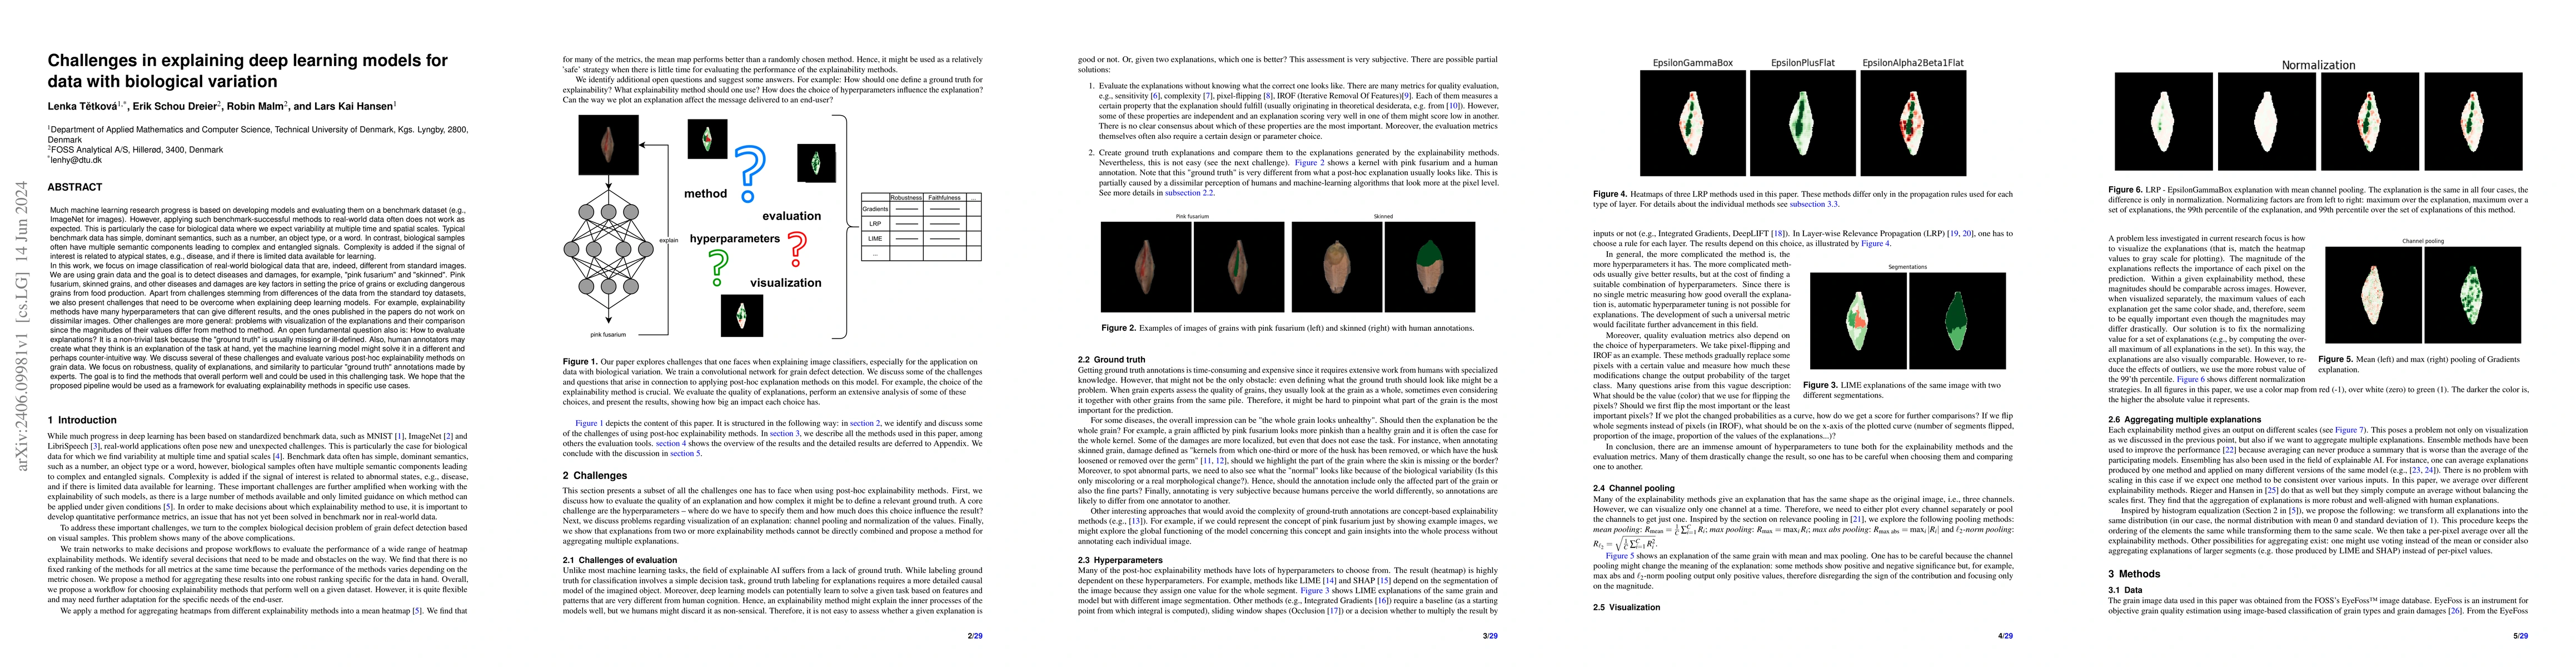
Much machine learning research progress is based on developing models and evaluating them on a benchmark dataset (e.g., ImageNet for images). However, applying such benchmark-successful methods to real-world data often does not work as expected. This is particularly the case for biological data where we expect variability at multiple time and spatial scales. In this work, we are using grain data and the goal is to detect diseases and damages. Pink fusarium, skinned grains, and other diseases and damages are key factors in setting the price of grains or excluding dangerous grains from food production. Apart from challenges stemming from differences of the data from the standard toy datasets, we also present challenges that need to be overcome when explaining deep learning models. For example, explainability methods have many hyperparameters that can give different results, and the ones published in the papers do not work on dissimilar images. Other challenges are more general: problems with visualization of the explanations and their comparison since the magnitudes of their values differ from method to method. An open fundamental question also is: How to evaluate explanations? It is a non-trivial task because the "ground truth" is usually missing or ill-defined. Also, human annotators may create what they think is an explanation of the task at hand, yet the machine learning model might solve it in a different and perhaps counter-intuitive way. We discuss several of these challenges and evaluate various post-hoc explainability methods on grain data. We focus on robustness, quality of explanations, and similarity to particular "ground truth" annotations made by experts. The goal is to find the methods that overall perform well and could be used in this challenging task. We hope the proposed pipeline will be used as a framework for evaluating explainability methods in specific use cases.
AI Key Findings
Get AI-generated insights about this paper's methodology, results, significance, and more — seven facets brought into focus.
Impact
Paper Details
Authors
PDF Preview
Key Terms
Citation Network
Current paper (gray), citations (green), references (blue)
Display is limited for performance on very large graphs.
Discussion 0