Summary
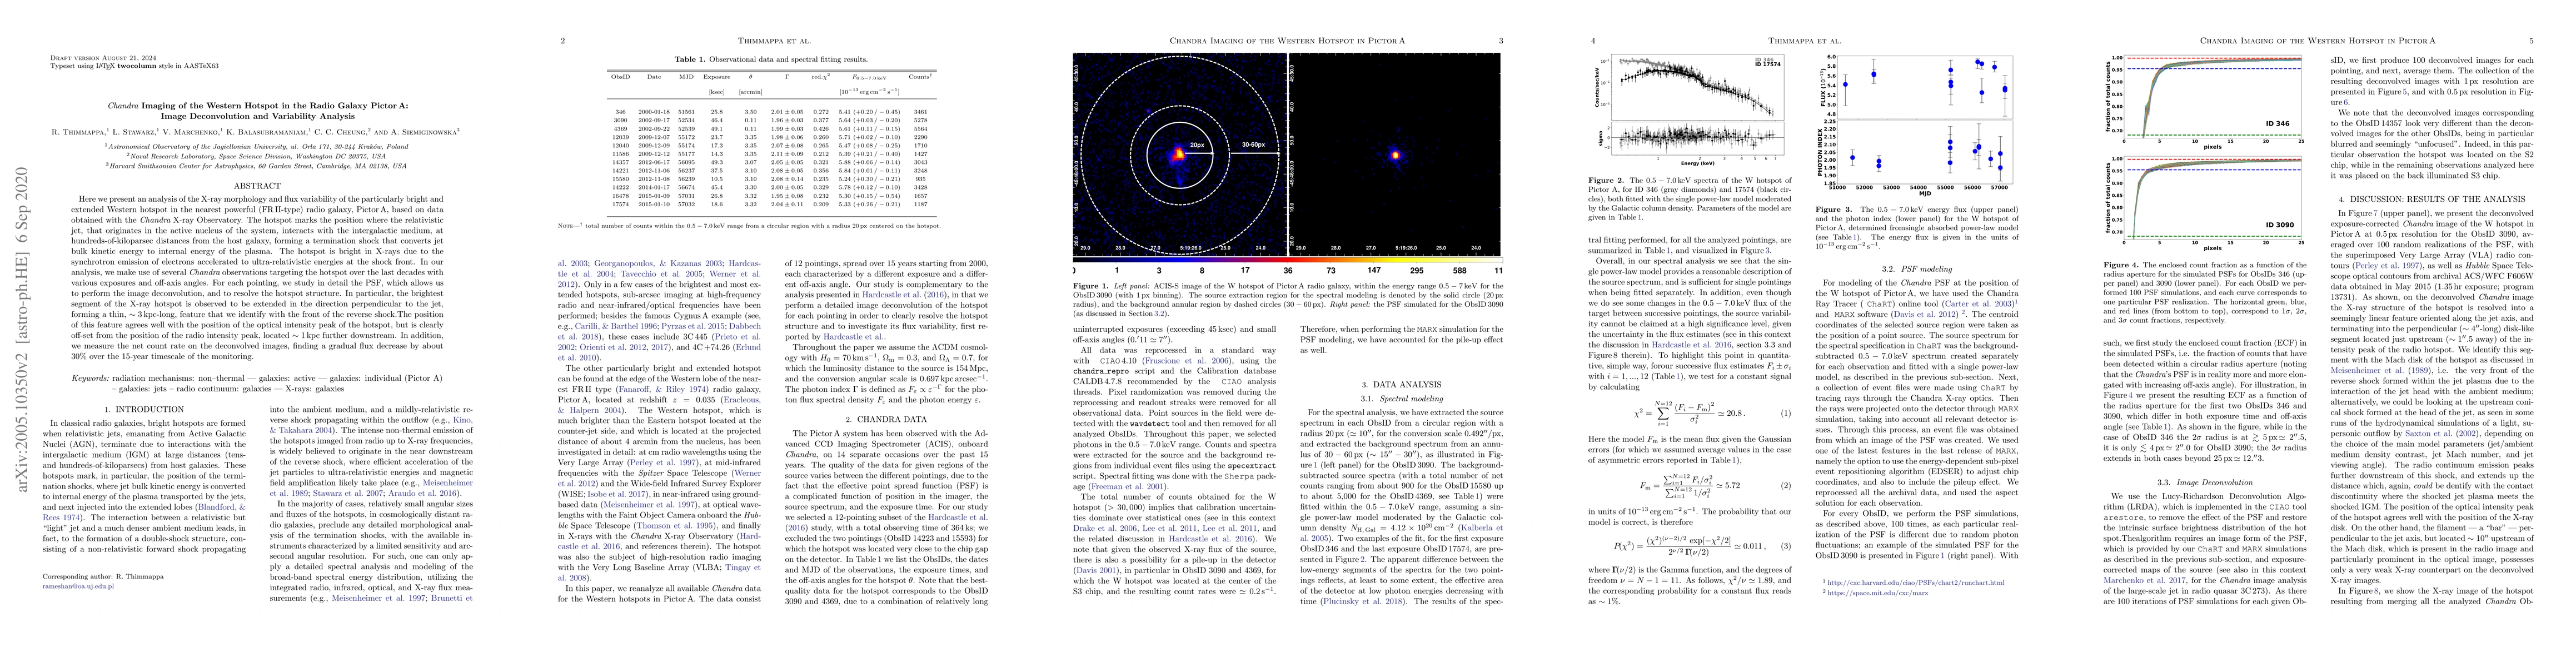
Here we present an analysis of the X-ray morphology and flux variability of the particularly bright and extended Western hotspot in the nearest powerful (FR II-type) radio galaxy, Pictor A, based on data obtained with the Chandra X-ray Observatory. The hotspot marks the position where the relativistic jet, that originates in the active nucleus of the system, interacts with the intergalactic medium, at hundreds-of-kiloparsec distances from the host galaxy, forming a termination shock that converts jet bulk kinetic energy to internal energy of the plasma. The hotspot is bright in X-rays due to the synchrotron emission of electrons accelerated to ultra-relativistic energies at the shock front. In our analysis, we make use of several Chandra observations targeting the hotspot over the last decades with various exposures and off-axis angles. For each pointing, we study in detail the PSF, which allows us to perform the image deconvolution, and to resolve the hotspot structure. In particular, the brightest segment of the X-ray hotspot is observed to be extended in the direction perpendicular to the jet, forming a thin, $\sim$3 kpc-long, feature that we identify with the front of the reverse shock. The position of this feature agrees well with the position of the optical intensity peak of the hotspot, but is clearly off-set from the position of the radio intensity peak, located $\sim$1 kpc further downstream. In addition, we measure the net count rate on the deconvolved images, finding a gradual flux decrease by about 30% over the 15-year timescale of the monitoring.
AI Key Findings
Get AI-generated insights about this paper's methodology, results, and significance.
Paper Details
PDF Preview
Key Terms
Citation Network
Current paper (gray), citations (green), references (blue)
Display is limited for performance on very large graphs.
Similar Papers
Found 4 papersCharacterization of the western Pictor A hotspot in the hard X-rays with NuSTAR
Eileen T. Meyer, Sibasish Laha, Markos Georganopoulos et al.
Multiwavelength study of radio galaxy Pictor A: detection of western hotspot in far-UV and possible origin of high energy emissions
C. S. Stalin, P. Sreekumar, Debbijoy Bhattacharya et al.
A Spectropolarimetric Study of Pictor A Radio Galaxy with MeerKAT
Oleg M. Smirnov, Lexy A. L. Andati, Lerato M. Baidoo et al.
| Title | Authors | Year | Actions |
|---|
Comments (0)