Publication
Metrics
AI Quick Summary
A study finds that income volatility has risen for high-risk individuals, such as self-employed individuals and those who identify as risk-tolerant, but not for the general population.
Paper Preview
Abstract
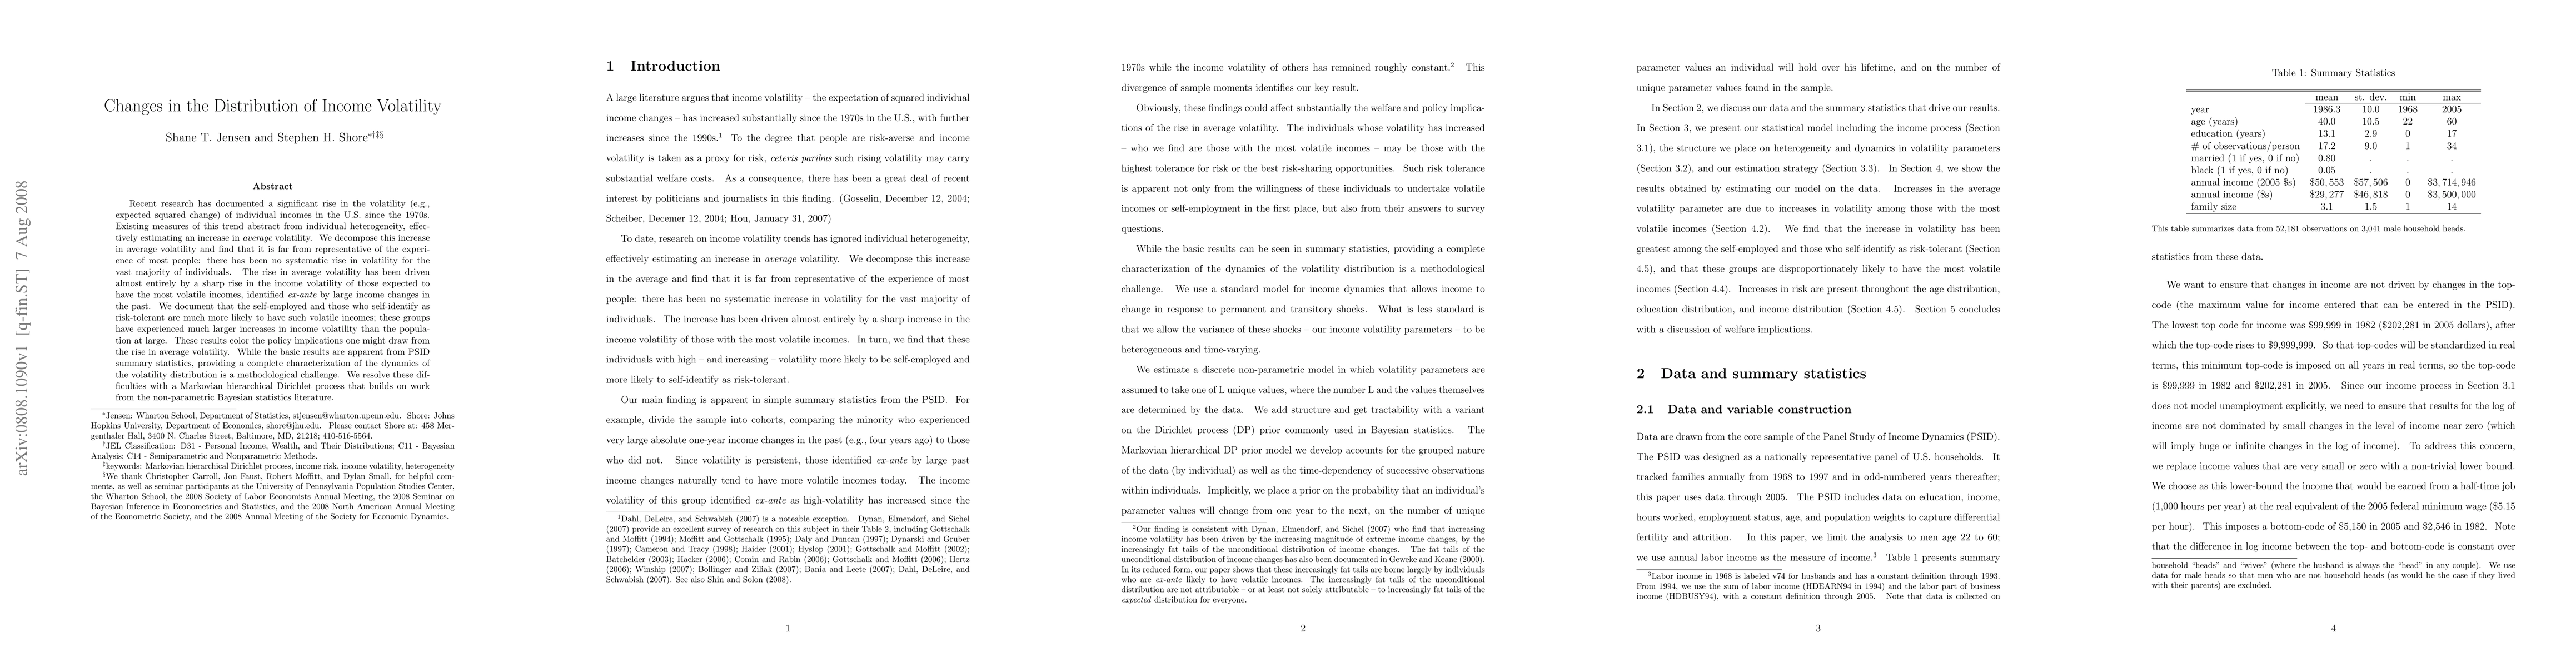
Recent research has documented a significant rise in the volatility (e.g., expected squared change) of individual incomes in the U.S. since the 1970s. Existing measures of this trend abstract from individual heterogeneity, effectively estimating an increase in average volatility. We decompose this increase in average volatility and find that it is far from representative of the experience of most people: there has been no systematic rise in volatility for the vast majority of individuals. The rise in average volatility has been driven almost entirely by a sharp rise in the income volatility of those expected to have the most volatile incomes, identified ex-ante by large income changes in the past. We document that the self-employed and those who self-identify as risk-tolerant are much more likely to have such volatile incomes; these groups have experienced much larger increases in income volatility than the population at large. These results color the policy implications one might draw from the rise in average volatility. While the basic results are apparent from PSID summary statistics, providing a complete characterization of the dynamics of the volatility distribution is a methodological challenge. We resolve these difficulties with a Markovian hierarchical Dirichlet process that builds on work from the non-parametric Bayesian statistics literature.
AI Key Findings
Get AI-generated insights about this paper's methodology, results, significance, and more — seven facets brought into focus.
Impact
Paper Details
PDF Preview
Key Terms
Citation Network
Current paper (gray), citations (green), references (blue)
Display is limited for performance on very large graphs.
Discussion 0