Characterization of differentially expressed genes using high-dimensional co-expression networks
Publication
Metrics
AI Quick Summary
This paper introduces a method to characterize differentially expressed genes through high-dimensional co-expression networks using Gaussian graphical models, minimizing the Bayesian Information Criterion to avoid redundancy and spurious information. It proposes a measure of uncertainty based on gene connectivity to identify informative differentially expressed genes.
Paper Preview
Abstract
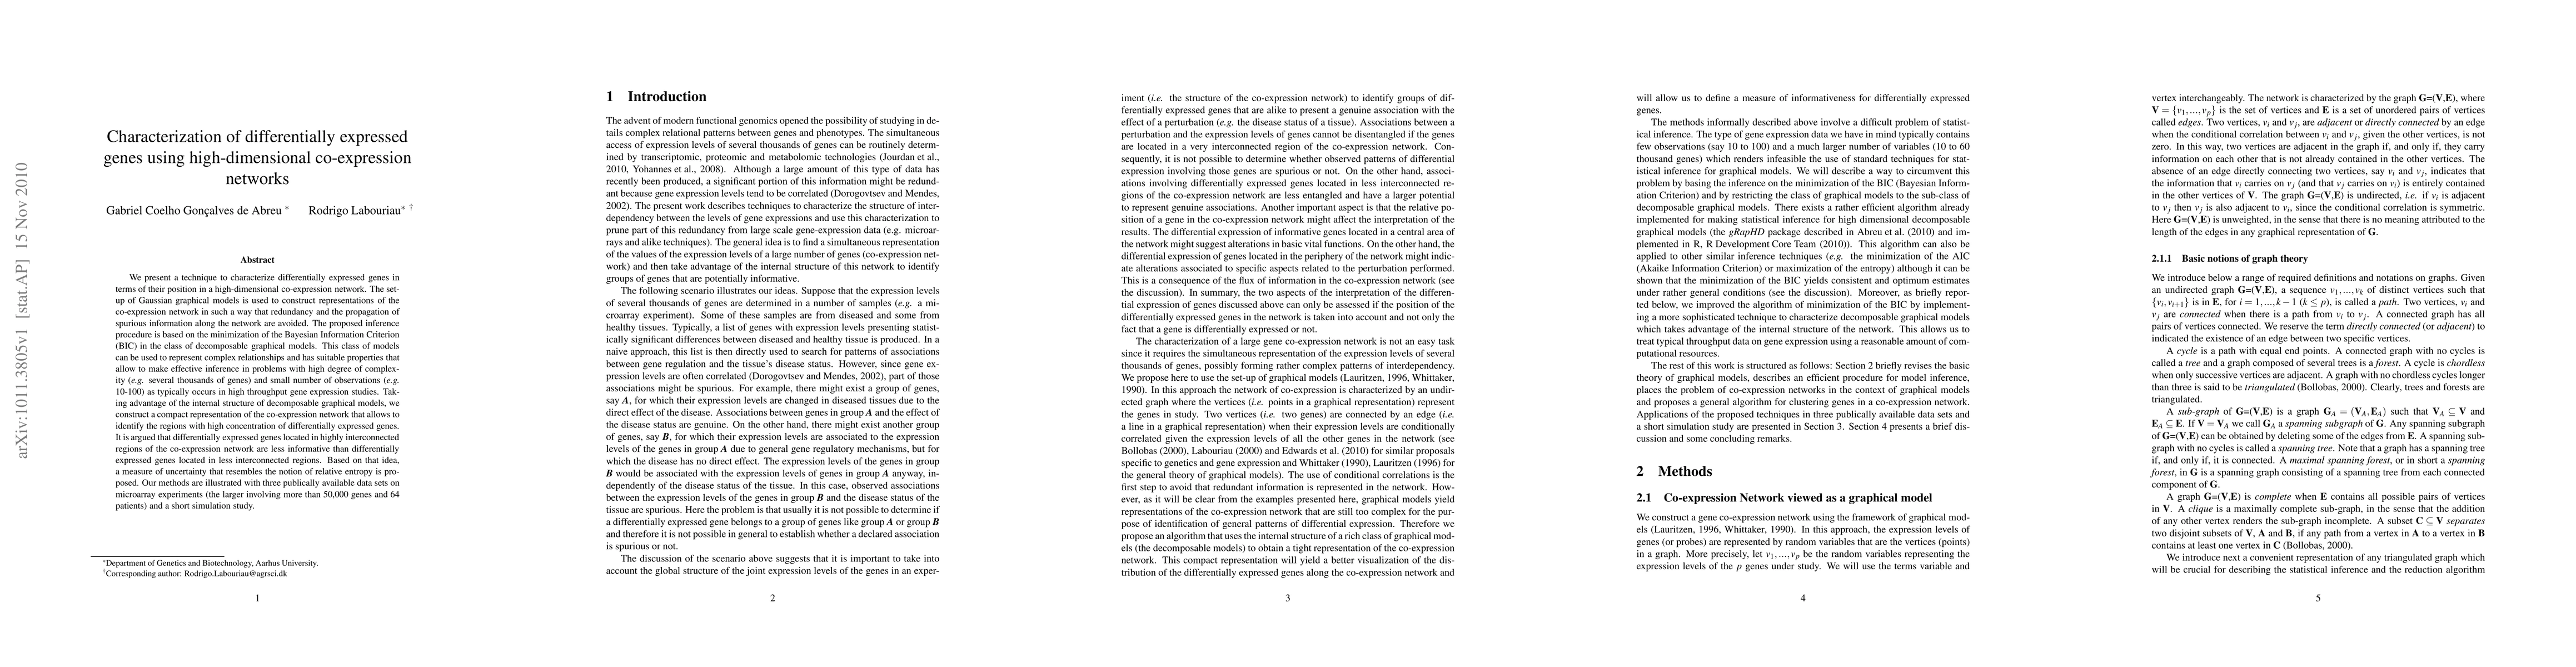
We present a technique to characterize differentially expressed genes in terms of their position in a high-dimensional co-expression network. The set-up of Gaussian graphical models is used to construct representations of the co-expression network in such a way that redundancy and the propagation of spurious information along the network are avoided. The proposed inference procedure is based on the minimization of the Bayesian Information Criterion (BIC) in the class of decomposable graphical models. This class of models can be used to represent complex relationships and has suitable properties that allow to make effective inference in problems with high degree of complexity (e.g. several thousands of genes) and small number of observations (e.g. 10-100) as typically occurs in high throughput gene expression studies. Taking advantage of the internal structure of decomposable graphical models, we construct a compact representation of the co-expression network that allows to identify the regions with high concentration of differentially expressed genes. It is argued that differentially expressed genes located in highly interconnected regions of the co-expression network are less informative than differentially expressed genes located in less interconnected regions. Based on that idea, a measure of uncertainty that resembles the notion of relative entropy is proposed. Our methods are illustrated with three publically available data sets on microarray experiments (the larger involving more than 50,000 genes and 64 patients) and a short simulation study.
AI Key Findings
Get AI-generated insights about this paper's methodology, results, significance, and more — seven facets brought into focus.
Impact
Paper Details
PDF Preview
Key Terms
Citation Network
Current paper (gray), citations (green), references (blue)
Display is limited for performance on very large graphs.
Discussion 0