This study, involving 158 participants and an interactive CO2 data visualization tool, explores how users derive insights through entity-based interactions (actions on data entities). Results indicate that referencing entities during interaction, rather than just interacting, improves insight characterization. Detailed insights were found to correlate with more mouse-overs in the chart area and references to vertical reference lines. The findings suggest potential for knowledge-assisted visualization, like insight recommendations based on user exploration.
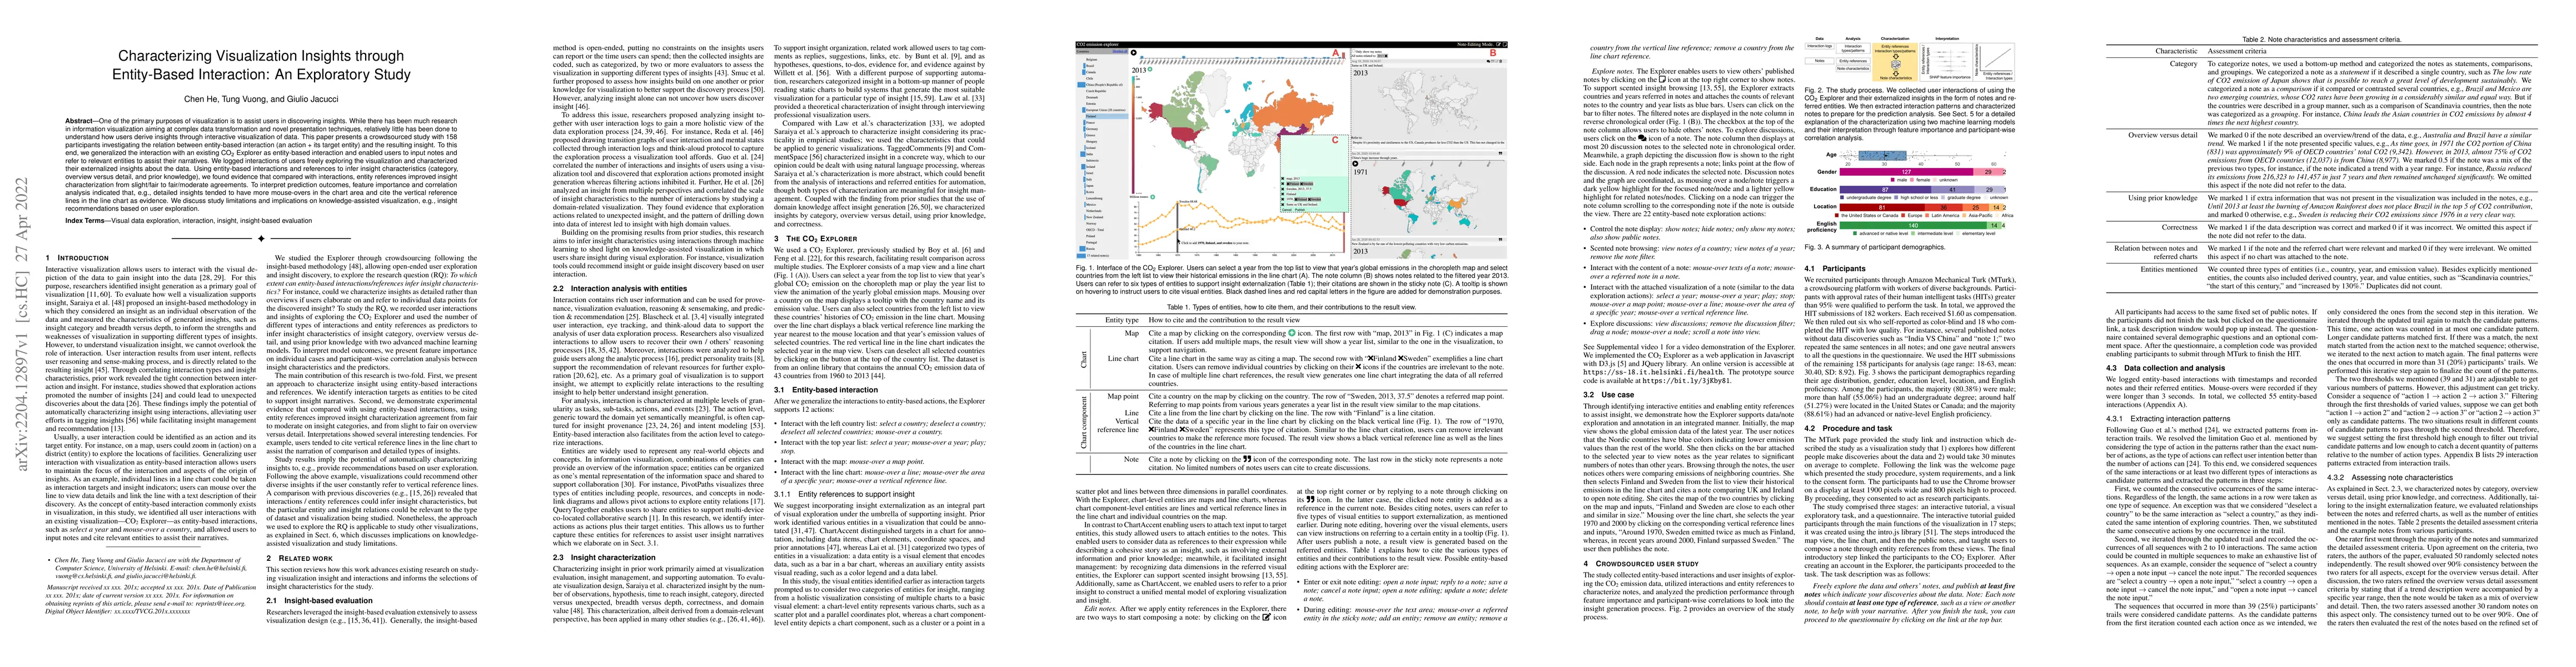
One of the primary purposes of visualization is to assist users in discovering insights. While there has been much research in information visualization aiming at complex data transformation and novel presentation techniques, relatively little has been done to understand how users derive insights through interactive visualization of data. This paper presents a crowdsourced study with 158 participants investigating the relation between entity-based interaction (an action + its target entity) and the resulting insight. To this end, we generalized the interaction with an existing CO2 Explorer as entity-based interaction and enabled users to input notes and refer to relevant entities to assist their narratives. We logged interactions of users freely exploring the visualization and characterized their externalized insights about the data. Using entity-based interactions and references to infer insight characteristics (category, overview versus detail, and prior knowledge), we found evidence that compared with interactions, entity references improved insight characterization from slight/fair to fair/moderate agreements. To interpret prediction outcomes, feature importance and correlation analysis indicated that, e.g., detailed insights tended to have more mouse-overs in the chart area and cite the vertical reference lines in the line chart as evidence. We discuss study limitations and implications on knowledge-assisted visualization, e.g., insight recommendations based on user exploration.
Get AI-generated insights about this paper's methodology, results, and significance.
Current paper (gray), citations (green), references (blue)
Ryan A. Rossi, Jeffrey Heer, Eunyee Koh et al.
Xinhuan Shu, Benjamin Bach, Jinrui Wang et al.
No citations found for this paper.
Title | Authors | Year | Actions |
---|---|---|---|
Tessera: Discretizing Data Analysis Workflows on a Task Level
|
Jing Nathan Yan, Ziwei Gu, Jeffrey M. Rzeszotarski
|
2021
|
View Paper |
Modeling and Leveraging Analytic Focus During Exploratory Visual Analysis
|
Zhilan Zhou, Ximing Wen, Yue Wang, D. Gotz
|
2021
|
View Paper |
LDA Ensembles for Interactive Exploration and Categorization of Behaviors
|
Siming Chen, N. Andrienko, G. Andrienko, Linara Adilova, Jérémie Barlet, Joerg Kindermann, P. H. Nguyen, Olivier Thonnard, C. Turkay
|
2020
|
View Paper |
What are Data Insights to Professional Visualization Users?
|
Po-Ming Law, A. Endert, J. Stasko
|
2020
|
View Paper |
Putting the “I” in Interaction: Interactive Interfaces Personalized to Individuals
|
John E. Wenskovitch, Michelle X. Zhou, C. Collins, Remco Chang, Michelle Dowling, A. Endert, Kai Xu, T. Rhyne
|
2020
|
View Paper |
Automatic Annotation Synchronizing with Textual Description for Visualization
|
Chufan Lai, Zhixian Lin, Ruike Jiang, Yun Han, Can Liu, Xiaoru Yuan
|
2020
|
View Paper |
Characterizing the Quality of Insight by Interactions: A Case Study
|
Chen He, L. Micallef, Liye He, Gopal Peddinti, T. Aittokallio, Giulio Jacucci
|
2020
|
View Paper |
Investigating Effects of Visual Anchors on Decision‐Making about Misinformation
|
Ryan Wesslen, Sashank Santhanam, Alireza Karduni, Isaac Cho, Samira Shaikh, Wenwen Dou
|
2019
|
View Paper |
Querytogether: Enabling entity-centric exploration in multi-device collaborative search
|
S. Andolina, Khalil Klouche, Tuukka Ruotsalo, P. Floréen, Giulio Jacucci
|
2018
|
View Paper |
From Hyperlinks to Hypercues: Entity-Based Affordances for Fluid Information Exploration
|
Khalil Klouche, Tuukka Ruotsalo, Giulio Jacucci
|
2018
|
View Paper |
Investigating the Effect of the Multiple Comparisons Problem in Visual Analysis
|
Emanuel Zgraggen, Zheguang Zhao, R. Zeleznik, Tim Kraska
|
2018
|
View Paper |
The Role of Explicit Knowledge: A Conceptual Model of Knowledge-Assisted Visual Analytics
|
P. Federico, Markus Wagner, A. Rind, Albert Amor-Amoros, S. Miksch, W. Aigner
|
2017
|
View Paper |
The Anchoring Effect in Decision-Making with Visual Analytics
|
Isaac Cho, Ryan Wesslen, Alireza Karduni, Sashank Santhanam, Samira Shaikh, Wenwen Dou
|
2017
|
View Paper |
A Unified Approach to Interpreting Model Predictions
|
Scott M. Lundberg, Su-In Lee
|
2017
|
View Paper |
ChartAccent: Annotation for data-driven storytelling
|
Donghao Ren, M. Brehmer, Bongshin Lee, Tobias Höllerer, E. Choe
|
2017
|
View Paper |
Visual analysis and coding of data-rich user behavior
|
Tanja Blascheck, Fabian Beck, Sebastian Baltes, Thomas Ertl, D. Weiskopf
|
2016
|
View Paper |
Modeling and evaluating user behavior in exploratory visual analysis
|
K. Reda, Andrew E. Johnson, M. Papka, J. Leigh
|
2016
|
View Paper |
A Case Study Using Visualization Interaction Logs and Insight Metrics to Understand How Analysts Arrive at Insights
|
Hua Guo, Steven R. Gomez, Caroline Ziemkiewicz, D. Laidlaw
|
2016
|
View Paper |
SensePath: Understanding the Sensemaking Process Through Analytic Provenance
|
P. H. Nguyen, Kai Xu, Ashley Wheat, B. Wong, S. Attfield, B. Fields
|
2016
|
View Paper |
VA2: A Visual Analytics Approach for Evaluating Visual Analytics Applications
|
Tanja Blascheck, M. John, K. Kurzhals, Steffen Koch, Thomas Ertl
|
2016
|
View Paper |
ranger: A Fast Implementation of Random Forests for High Dimensional Data in C++ and R
|
Marvin N. Wright, A. Ziegler
|
2015
|
View Paper |
Semantic Interaction: Coupling Cognition and Computation through Usable Interactive Analytics
|
A. Endert, Remco Chang, Chris North, Michelle X. Zhou
|
2015
|
View Paper |
Characterizing Visualization Insights from Quantified Selfers' Personal Data Presentations
|
E. Choe, Bongshin Lee, M. Schraefel
|
2015
|
View Paper |
Storytelling in Information Visualizations: Does it Engage Users to Explore Data?
|
Jeremy Boy, F. Détienne, Jean-Daniel Fekete
|
2015
|
View Paper |
The Effects of Interactive Latency on Exploratory Visual Analysis
|
Zhicheng Liu, Jeffrey Heer
|
2014
|
View Paper |
Finding Waldo: Learning about Users from their Interactions
|
Eli T. Brown, Alvitta Ottley, Helen Zhao, Quan Lin, Richard Souvenir, A. Endert, Remco Chang
|
2014
|
View Paper |
TaggedComments: promoting and integrating user comments in online application tutorials
|
Andrea Bunt, P. Dubois, B. Lafreniere, Michael A. Terry, David T. Cormack
|
2014
|
View Paper |
Understand users’ comprehension and preferences for composing information visualizations
|
Huahai Yang, Yunyao Li, Michelle X. Zhou
|
2014
|
View Paper |
Evaluating the Effect of Style in Information Visualization
|
A. Moere, M. Tomitsch, Christoph Wimmer, Christoph M. Bösch, T. Grechenig
|
2012
|
View Paper |
PivotPaths: Strolling through Faceted Information Spaces
|
M. Dörk, N. Riche, Gonzalo A. Ramos, S. Dumais
|
2012
|
View Paper |
D³ Data-Driven Documents
|
M. Bostock, Vadim Ogievetsky, Jeffrey Heer
|
2011
|
View Paper |
CommentSpace: structured support for collaborative visual analysis
|
Wesley Willett, Jeffrey Heer, J. Hellerstein, Maneesh Agrawala
|
2011
|
View Paper |
Click2Annotate: Automated Insight Externalization with rich semantics
|
Yang Chen, S. Barlowe, Jing Yang
|
2010
|
View Paper |
Helping users recall their reasoning process
|
H. Lipford, Felesia Stukes, Wenwen Dou, Matthew E. Hawkins, Remco Chang
|
2010
|
View Paper |
Many roads lead to Rome: Mapping users’ problem-solving strategies
|
E. Mayr, M. Smuc, Hanna Risku
|
2010
|
View Paper |
The Science of Interaction
|
W. Pike, J. Stasko, Remco Chang, T. O'Connell
|
2009
|
View Paper |
Recovering Reasoning Processes from User Interactions
|
Wenwen Dou, D. Jeong, Felesia Stukes, W. Ribarsky, H. Lipford, Remco Chang
|
2009
|
View Paper |
To Score or Not to Score? Tripling Insights for Participatory Design
|
M. Smuc, E. Mayr, T. Lammarsch, W. Aigner, S. Miksch, Gä Johannes rtner
|
2009
|
View Paper |
Characterizing Users' Visual Analytic Activity for Insight Provenance
|
D. Gotz, Michelle X. Zhou
|
2008
|
View Paper |
Generalized selection via interactive query relaxation
|
Jeffrey Heer, Maneesh Agrawala, Wesley Willett
|
2008
|
View Paper |
Understanding and characterizing insights: how do people gain insights using information visualization?
|
Ji Soo Yi, Youn ah Kang, J. Stasko, J. Jacko
|
2008
|
View Paper |
Scented Widgets: Improving Navigation Cues with Embedded Visualizations
|
Wesley Willett, Jeffrey Heer, Maneesh Agrawala
|
2007
|
View Paper |
A Model and Framework for Visualization Exploration
|
T. Jankun-Kelly, K. Ma, Michael Gertz
|
2007
|
View Paper |
Toward measuring visualization insight
|
Chris North
|
2006
|
View Paper |
An insight-based methodology for evaluating bioinformatics visualizations
|
Purvi Saraiya, Chris North, K. Duca
|
2005
|
View Paper |
Intro
|
S. Baum, B. Tonn
|
2003
|
View Paper |
Learning with Kernels: Support Vector Machines, Regularization, Optimization, and Beyond
|
Christopher K. I Williams
|
2003
|
View Paper |
Learning with Kernels: support vector machines, regularization, optimization, and beyond
|
B. Scholkopf, Alex Smola
|
2001
|
View Paper |
Adjusting for multiple testing--when and how?
|
R. Bender, S. Lange
|
2001
|
View Paper |
The measurement of observer agreement for categorical data.
|
J. Landis, G. Koch
|
1977
|
View Paper |
"Isms" in Visualization
|
Min Chen, D. Edwards
|
2020
|
View Paper |
shapper: Wrapper of python library ‘shap’
|
2020
|
||
healthcareai - R package
|
2020
|
||
HindSight: Encouraging Exploration through Direct Encoding of Personal Interaction History
|
Mi Feng, Cheng Deng, Evan M. Peck, Lane Harrison
|
2017
|
View Paper |
A Grammar-based Approach for Modeling User Interactions and Generating Suggestions During the Data Exploration Process
|
Filip Dabek, Jesus J. Caban
|
2017
|
View Paper |
Fair Statistical Communication in HCI
|
Pierre Dragicevic
|
2016
|
View Paper |
OECD Factbook 2015-2016
|
2016
|
||
Classification and Regression by randomForest
|
Andy Liaw, M. Wiener
|
2007
|
View Paper |
Information Visualization and Visual Data Mining
|
D. Keim
|
2002
|
View Paper |
Random Forests
|
L. Breiman
|
2001
|
View Paper |
Visualization Viewpoints Data, Information, and Knowledge in Visualization Defi Nitions of Data, Information, and Knowledge Perceptual and Cognitive Space
|
T. Rhyne, Min Chen, D. Ebert, H. Hagen, R. Laramee, R. van Liere, Amsterdam Cwi, Kwan-Liu, Ma, W. Ribarsky, G. Scheuermann, D. Silver, Ed H Chi, B. Shneiderman, Melanie Tory, Torsten Möller
|
View Paper | |
Support Vector Machines: The Interface to libsvm in package e1071
|
View Paper | ||
AND T
|
MD YOSHIO KINAMI, I. Miyazaki, Mdi
|
View Paper | |
Editing notes or entities: mouse-overs in the text area of the sticky note (hoverTextarea); open a note input → hoverTextarea/add an entity; open a note input → hoverTextarea → add an entity
|
|||
window; activate the task window
|
|||
filter; drag a node
|
|||
Entity-Based Insight Discovery in Visual Data Exploration .
|
|||
• 6 transition patterns among data/note exploration and editing. Data exploration: SelCountry → mouse-over a vertical reference line
|
|||
Interact with the attached visualization of a note (similar to the data exploration actions): select a year
|
|||
stop; mouse-over a map point; mouse-over a line; mouse-over the area of a specific year; mouse-over a vertical reference line. Explore discussions: view discussions
|
|||
Holistic note editing patterns: open a note input → add an entity → hoverTextarea → save a note
|
|||
Control the note display: show notes; hide notes; only show my notes; also show public notes
|
Showing first page preview. Click "Open Full PDF" to view the complete paper.
Your comment contains inappropriate language and has been rejected.
Are you sure you want to remove this tag? This action cannot be undone.
Someone just found a breakthrough paper!
Comments (0)