Publication

Published: Apr 09, 2024
Updated: Jun 09, 2025
Categories: cs.HC

Metrics

Citations: 1
Source: ArXiv

Quick Actions

View PDF

AI Quick Summary

This paper investigates differences in spoken versus typed instructions for chart creation in AI-assisted systems, revealing distinct command formats and linguistic features in voice instructions. The study proposes guidelines for voice-based systems and enhancements for text-based systems to better support speech modality.

Paper Preview

Abstract

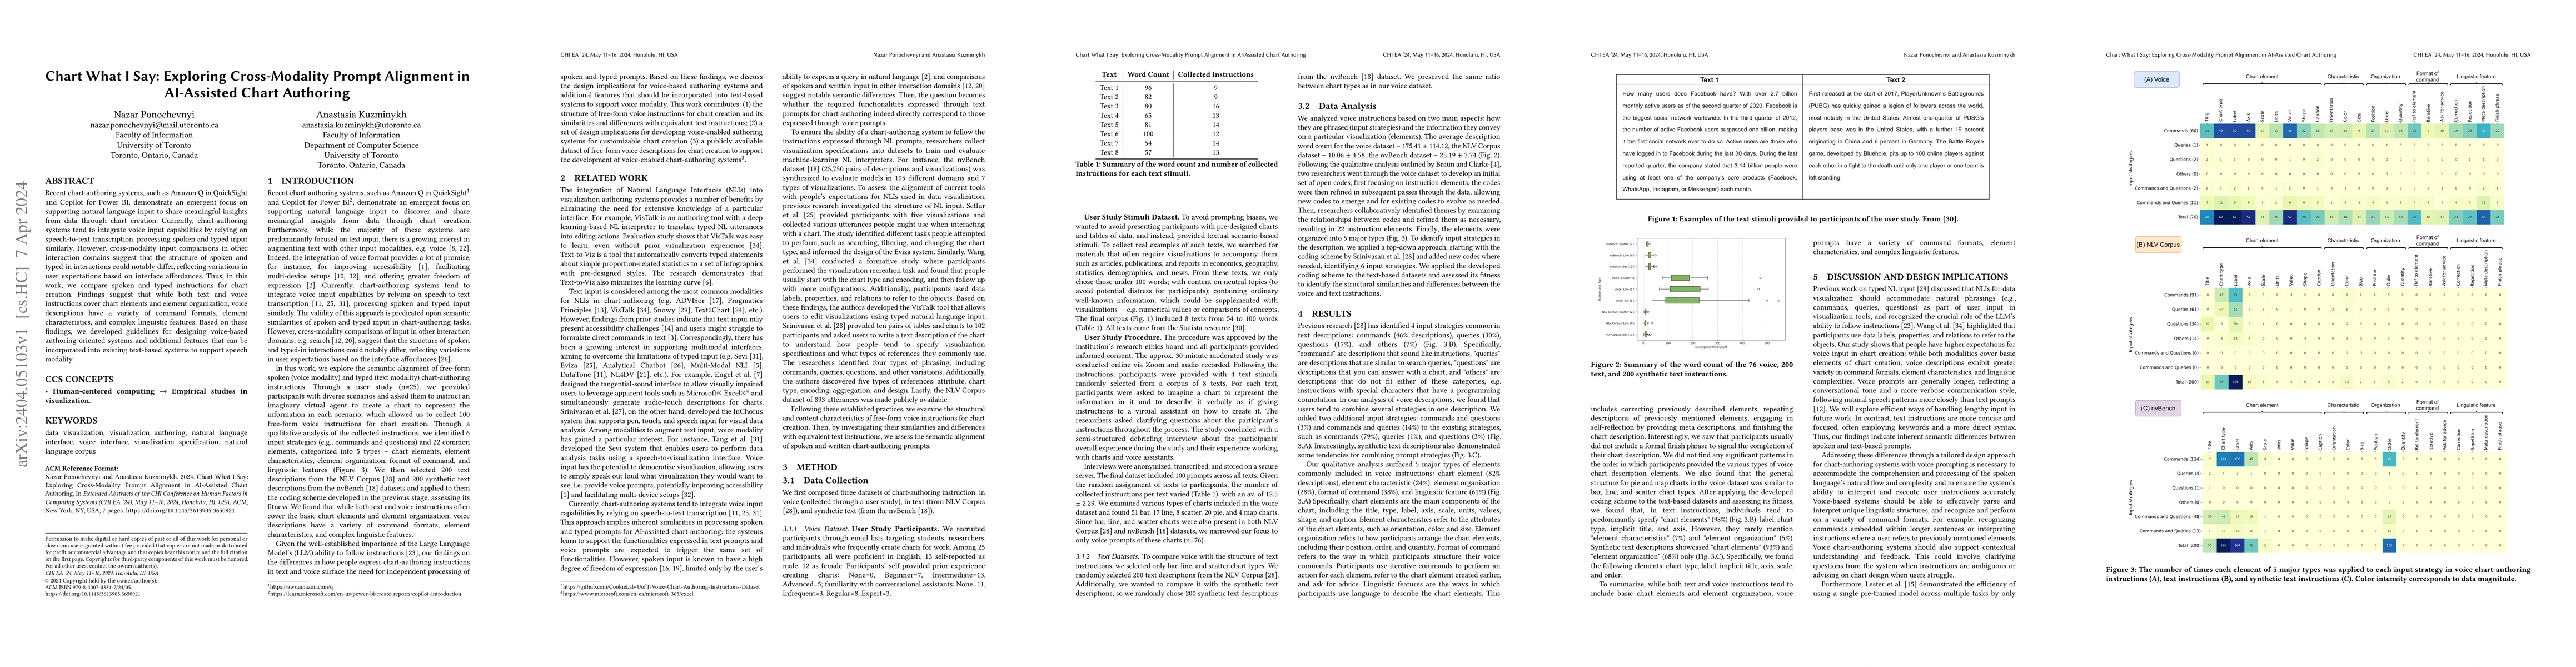
Recent chart-authoring systems, such as Amazon Q in QuickSight and Copilot for Power BI, demonstrate an emergent focus on supporting natural language input to share meaningful insights from data through chart creation. Currently, chart-authoring systems tend to integrate voice input capabilities by relying on speech-to-text transcription, processing spoken and typed input similarly. However, cross-modality input comparisons in other interaction domains suggest that the structure of spoken and typed-in interactions could notably differ, reflecting variations in user expectations based on interface affordances. Thus, in this work, we compare spoken and typed instructions for chart creation. Findings suggest that while both text and voice instructions cover chart elements and element organization, voice descriptions have a variety of command formats, element characteristics, and complex linguistic features. Based on these findings, we developed guidelines for designing voice-based authoring-oriented systems and additional features that can be incorporated into existing text-based systems to support speech modality.

AI Key Findings

Get AI-generated insights about this paper's methodology, results, and significance.

Paper Details

Paper ID: 2404.05103
License: http://arxiv.org/licenses/nonexclusive-distrib/1.0/
Comments: Will be published In Extended Abstracts of the CHI Conference on Human Factors in Computing Systems (CHI EA 2024)
Categories:
cs.HC

How to Cite This Paper

BibTeX
@article{kuzminykh2024chart,
  title         = {Chart What I Say: Exploring Cross-Modality Prompt Alignment in
  AI-Assisted Chart Authoring},
  author        = {Kuzminykh, Anastasia and Ponochevnyi, Nazar},
  year          = {2024},
  eprint        = {2404.05103},
  archivePrefix = {arXiv},
  primaryClass  = {cs.HC},
  doi           = {10.1145/3613905.3650921},
}
APA 7
Kuzminykh, A., & Ponochevnyi, N. (2024). Chart What I Say: Exploring Cross-Modality Prompt Alignment in
  AI-Assisted Chart Authoring. arXiv. https://doi.org/10.1145/3613905.3650921
MLA 9
Kuzminykh, Anastasia, and Nazar Ponochevnyi. "Chart What I Say: Exploring Cross-Modality Prompt Alignment in
  AI-Assisted Chart Authoring." arXiv, 2024, doi.org/10.1145/3613905.3650921.

Key Terms

instructions (0.247)
modality (0.237)
input (0.216)
creation (0.215)
text (0.214)
speech (0.207)
element (0.186)
findings (0.168)

Citation Network

Current paper (gray), citations (green), references (blue)

Display is limited for performance on very large graphs.

Current Paper
Citations
References
Click to view

Similar Papers

Found 4 papers

What Does the Chart Say? Grouping Cues Guide Viewer Comparisons and Conclusions in Bar Charts

Cindy Xiong Bearfield, Chase Stokes, Andrew Lovett et al.

2023-10-04

Talk Me Through It: Developing Effective Systems for Chart Authoring

Nazar Ponochevnyi, Young-Ho Kim, Joseph Jay Williams et al.

2026-01-21

Are you doing what I say? On modalities alignment in ALFRED

Yau-Shian Wang, Yi-Ting Yeh, Ta-Chung Chi et al.

2021-10-13

Do What I Say: A Spoken Prompt Dataset for Instruction-Following

Maike Züfle, Sara Papi, Fabian Retkowski et al.

2026-03-10
Title Authors Year Actions

Comments (0)

This website uses cookies to ensure you get the best experience. Learn more