Chart2Vec: A Universal Embedding of Context-Aware Visualizations
Publication
Metrics
AI Quick Summary
Chart2Vec proposes a universal embedding model to represent context-aware visualizations by integrating structural and semantic information, using multi-task learning to enhance context awareness. Evaluations demonstrate its effectiveness and consistency with human cognition compared to existing methods.
Paper Preview
Abstract
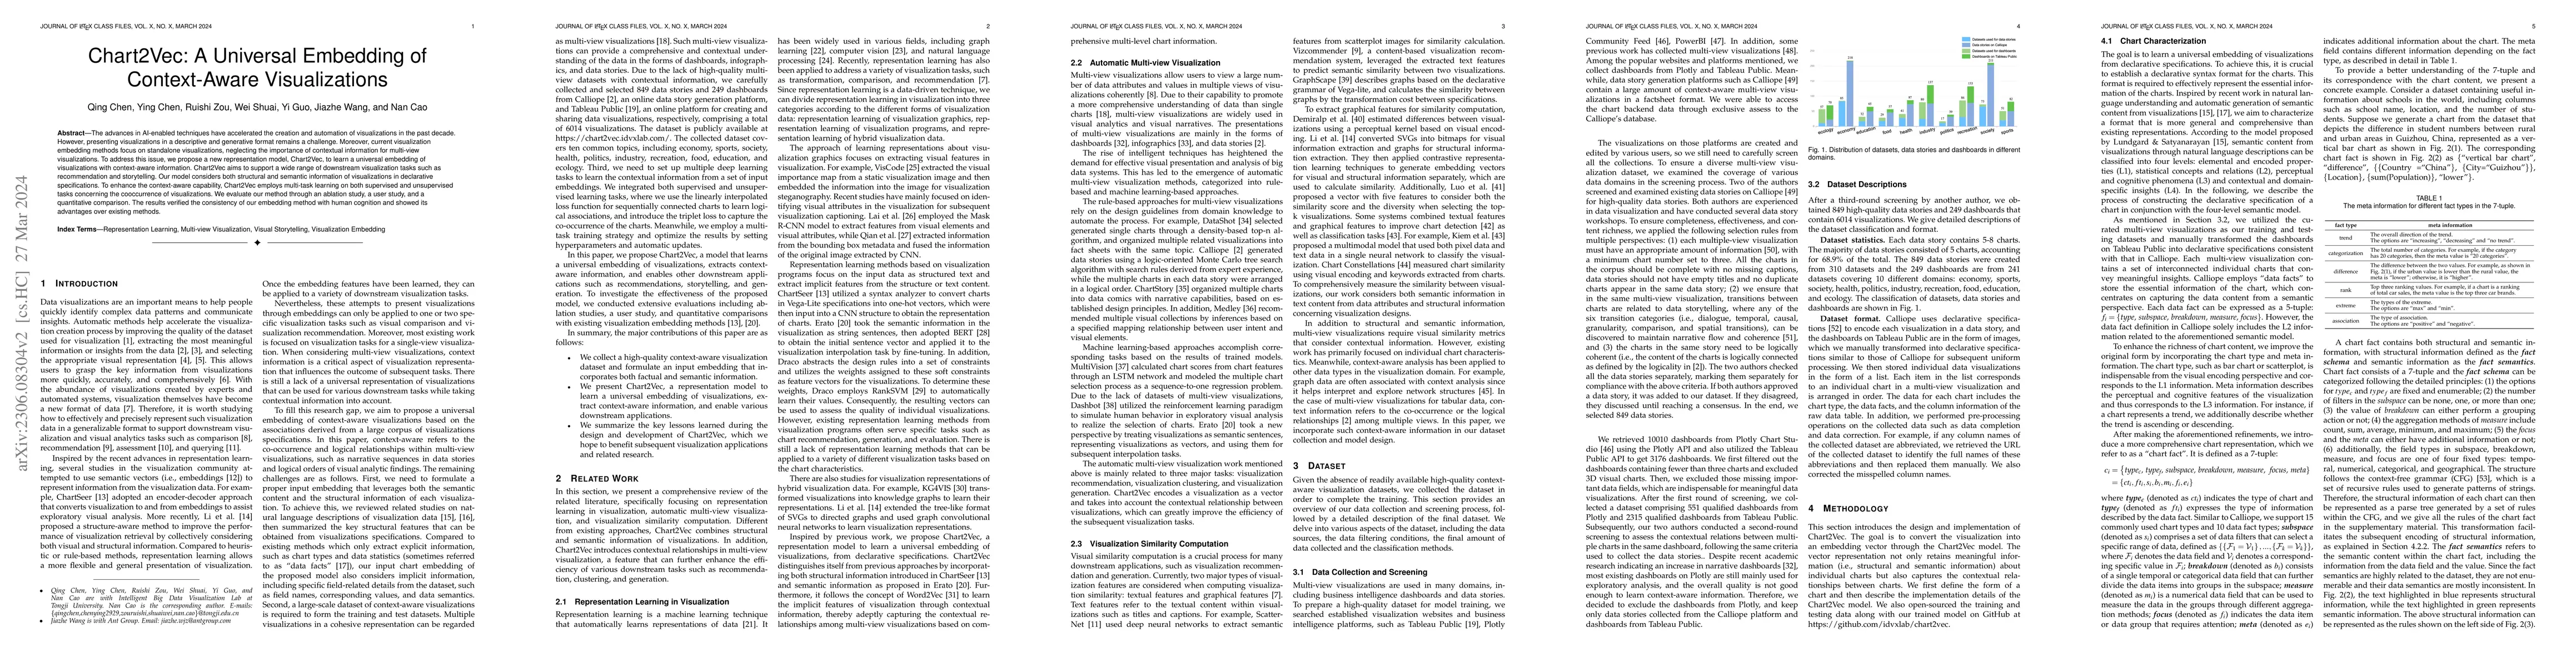
The advances in AI-enabled techniques have accelerated the creation and automation of visualizations in the past decade. However, presenting visualizations in a descriptive and generative format remains a challenge. Moreover, current visualization embedding methods focus on standalone visualizations, neglecting the importance of contextual information for multi-view visualizations. To address this issue, we propose a new representation model, Chart2Vec, to learn a universal embedding of visualizations with context-aware information. Chart2Vec aims to support a wide range of downstream visualization tasks such as recommendation and storytelling. Our model considers both structural and semantic information of visualizations in declarative specifications. To enhance the context-aware capability, Chart2Vec employs multi-task learning on both supervised and unsupervised tasks concerning the cooccurrence of visualizations. We evaluate our method through an ablation study, a user study, and a quantitative comparison. The results verified the consistency of our embedding method with human cognition and showed its advantages over existing methods.
AI Key Findings
Get AI-generated insights about this paper's methodology, results, significance, and more — seven facets brought into focus.
Impact
Paper Details
Authors
PDF Preview
Key Terms
Citation Network
Current paper (gray), citations (green), references (blue)
Display is limited for performance on very large graphs.
Discussion 0