ChartBench: A Benchmark for Complex Visual Reasoning in Charts
Publication
Metrics
AI Quick Summary
ChartBench is a new benchmark for evaluating complex visual reasoning in charts, addressing the limitations of current benchmarks by including 42 categories, 66.6k charts, and 600k question-answer pairs. It introduces an enhanced evaluation metric, Acc+, and proposes two baselines to improve model performance, revealing significant gaps in current multimodal large language models' chart comprehension abilities.
Paper Preview
Abstract
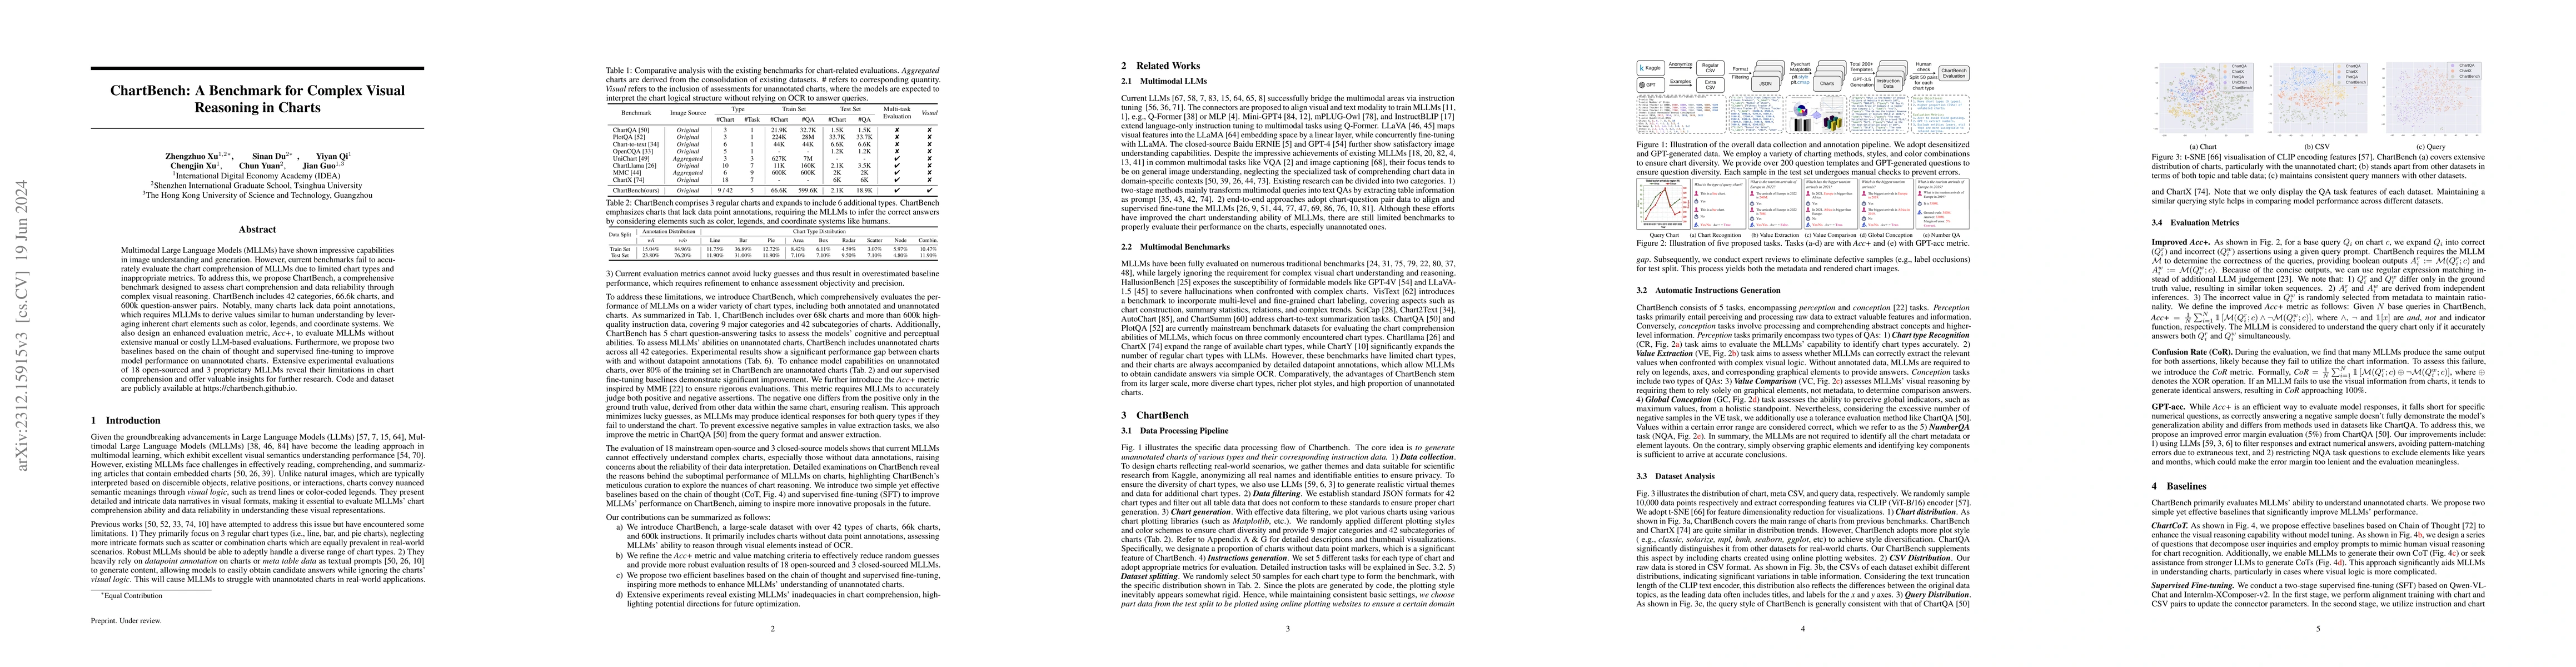
Multimodal Large Language Models (MLLMs) have shown impressive capabilities in image understanding and generation. However, current benchmarks fail to accurately evaluate the chart comprehension of MLLMs due to limited chart types and inappropriate metrics. To address this, we propose ChartBench, a comprehensive benchmark designed to assess chart comprehension and data reliability through complex visual reasoning. ChartBench includes 42 categories, 66.6k charts, and 600k question-answer pairs. Notably, many charts lack data point annotations, which requires MLLMs to derive values similar to human understanding by leveraging inherent chart elements such as color, legends, and coordinate systems. We also design an enhanced evaluation metric, Acc+, to evaluate MLLMs without extensive manual or costly LLM-based evaluations. Furthermore, we propose two baselines based on the chain of thought and supervised fine-tuning to improve model performance on unannotated charts. Extensive experimental evaluations of 18 open-sourced and 3 proprietary MLLMs reveal their limitations in chart comprehension and offer valuable insights for further research. Code and dataset are publicly available at https://chartbench.github.io.
OpenAlex
- Citations in OpenAlex
- 1
- Publication year
- 2023
- Access status
- Open access
Source: OpenAlex · Snapshot
AI Key Findings
Get AI-generated insights about this paper's methodology, results, significance, and more — seven facets brought into focus.
Impact
Authors
PDF Preview
Key Terms
Citation Network
Current paper (gray), citations (green), references (blue)
Display is limited for performance on very large graphs.
Discussion 0