ChartCheck: Explainable Fact-Checking over Real-World Chart Images
Publication
Metrics
AI Quick Summary
Summary: ChartCheck introduces a new dataset for fact-checking real-world chart images, aiming to address misinformation in data visualizations. The dataset includes 1,700 charts and 10,500 claims, providing explanations for evaluation against vision-language models, and proposes a baseline for future research.
Paper Preview
Abstract
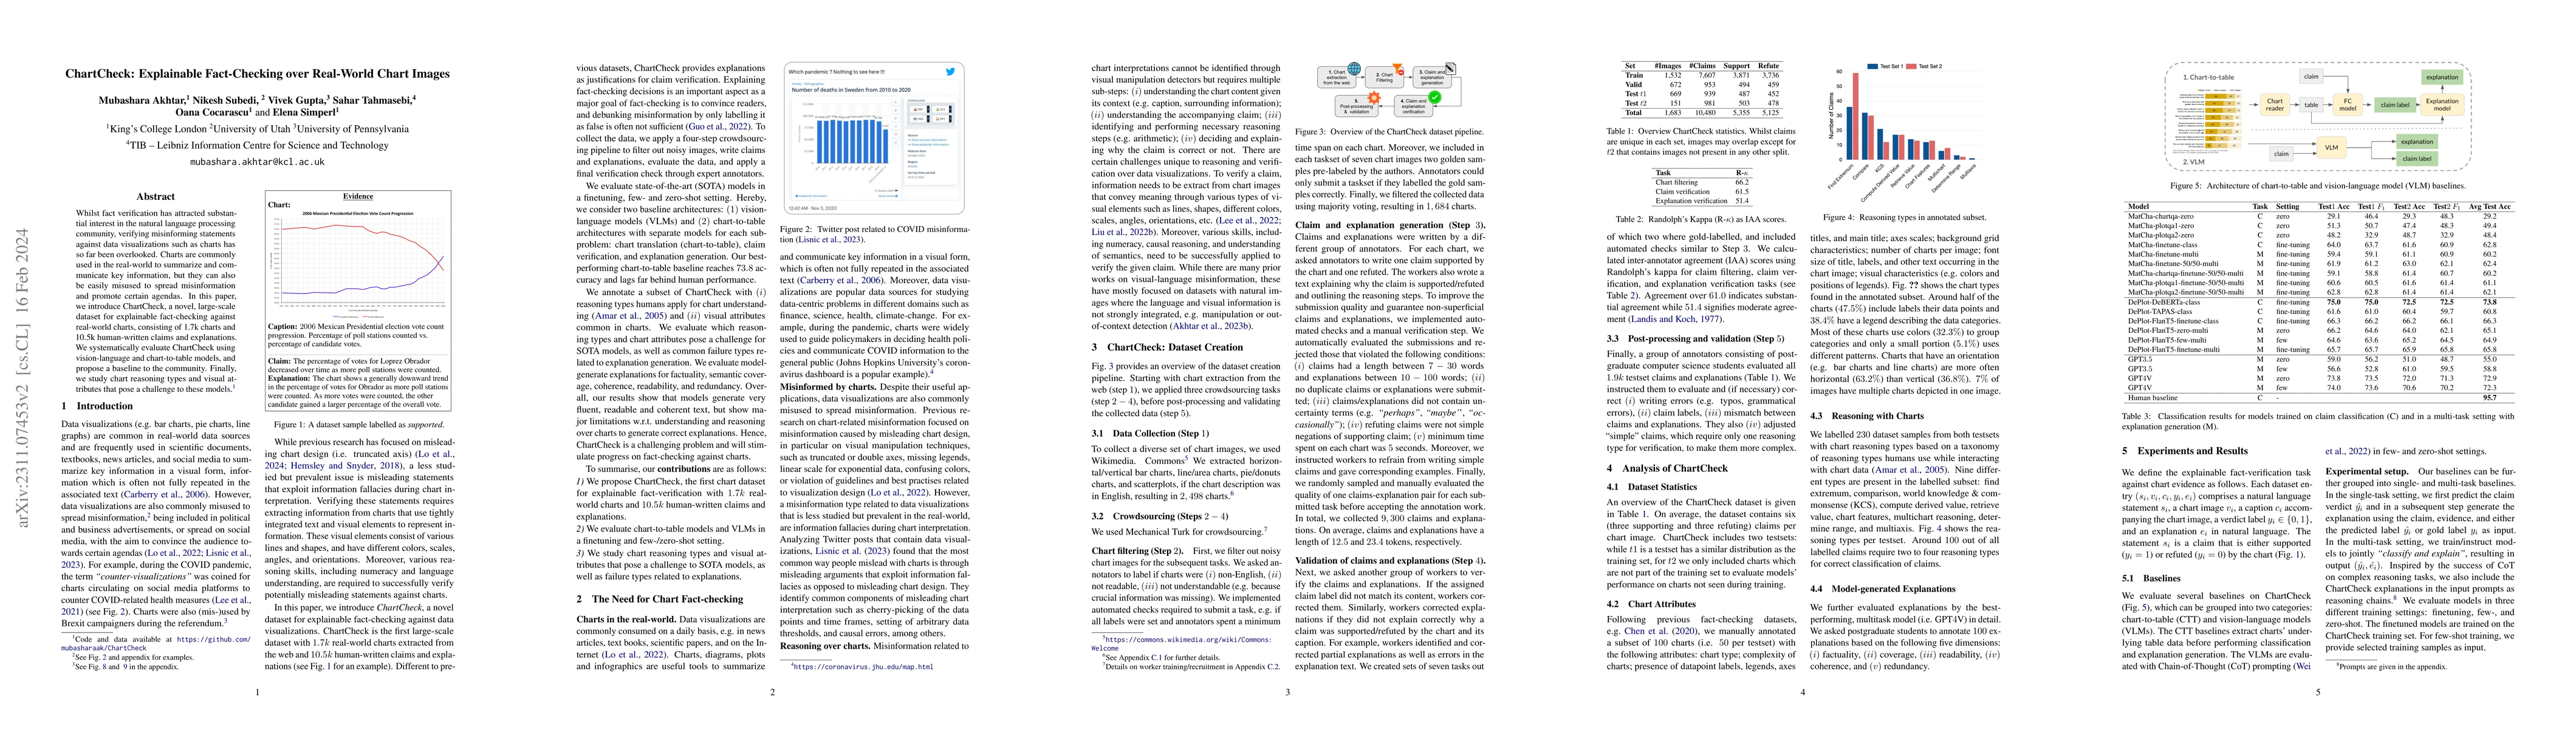
Whilst fact verification has attracted substantial interest in the natural language processing community, verifying misinforming statements against data visualizations such as charts has so far been overlooked. Charts are commonly used in the real-world to summarize and communicate key information, but they can also be easily misused to spread misinformation and promote certain agendas. In this paper, we introduce ChartCheck, a novel, large-scale dataset for explainable fact-checking against real-world charts, consisting of 1.7k charts and 10.5k human-written claims and explanations. We systematically evaluate ChartCheck using vision-language and chart-to-table models, and propose a baseline to the community. Finally, we study chart reasoning types and visual attributes that pose a challenge to these models
AI Key Findings
Get AI-generated insights about this paper's methodology, results, significance, and more — seven facets brought into focus.
Impact
Paper Details
Authors
PDF Preview
Key Terms
Citation Network
Current paper (gray), citations (green), references (blue)
Display is limited for performance on very large graphs.
Discussion 0