AI Quick Summary
ChartCitor is a multi-agent framework that enhances chart question-answering by generating fine-grained bounding box citations to verify responses, addressing issues with existing methods' visual-semantic context and complex layout alignment. It improves user trust and productivity in Generative AI-assisted chart QA through better explainability.
Quick Answers
What is "ChartCitor: Multi-Agent Framework for Fine-Grained Chart Visual Attribution" about?
ChartCitor is a multi-agent framework that enhances chart question-answering by generating fine-grained bounding box citations to verify responses, addressing issues with existing methods' visual-semantic context and complex layout alignment. It improves user trust and productivity in Generative AI-assisted chart QA through better explainability.
What methodology did the authors use?
ChartCitor is a multi-agent framework that uses LLM agents to perform chart-to-table extraction, answer reformulation, table augmentation, evidence retrieval through pre-filtering and re-ranking, and table-to-chart mapping for fine-grained bounding box citations in chart images. More in Methodology →
What are the key results?
ChartCitor outperforms existing baselines across different chart types. — Qualitative user studies show increased user trust in Generative AI with enhanced explainability for LLM-assisted chart QA. More in Key Results →
Why is this work significant?
This research is significant as it addresses the issue of hallucinations in LLMs for chart question-answering tasks, providing fine-grained visual evidence and improving user trust and productivity for professionals. More in Significance →
What are the main limitations?
The paper does not discuss potential limitations or challenges encountered during development or evaluation. — No explicit mention of resource requirements or scalability issues. More in Limitations →
Abstract
Large Language Models (LLMs) can perform chart question-answering tasks but often generate unverified hallucinated responses. Existing answer attribution methods struggle to ground responses in source charts due to limited visual-semantic context, complex visual-text alignment requirements, and difficulties in bounding box prediction across complex layouts. We present 
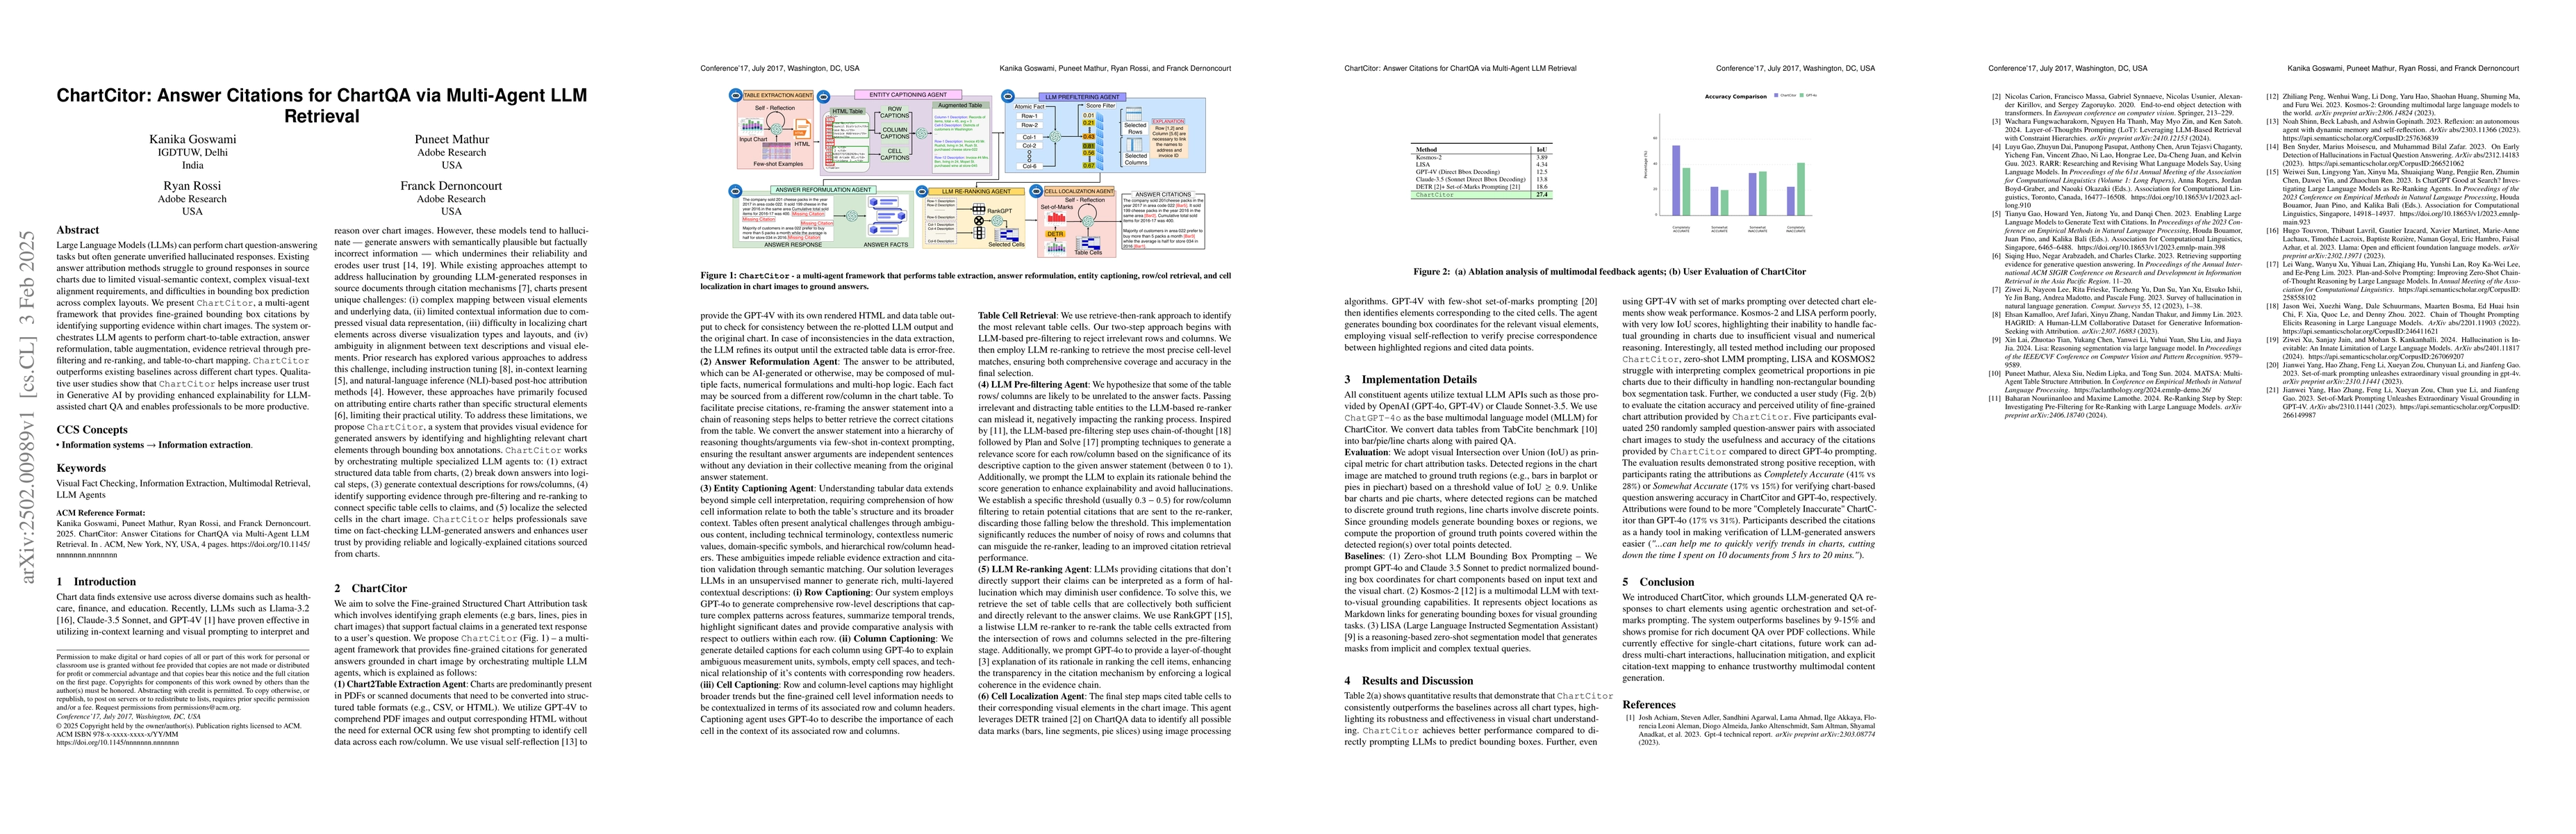
ChartCitor, a multi-agent framework that provides fine-grained bounding box citations by identifying supporting evidence within chart images. The system orchestrates LLM agents to perform chart-to-table extraction, answer reformulation, table augmentation, evidence retrieval through pre-filtering and re-ranking, and table-to-chart mapping. ChartCitor outperforms existing baselines across different chart types. Qualitative user studies show that ChartCitor helps increase user trust in Generative AI by providing enhanced explainability for LLM-assisted chart QA and enables professionals to be more productive.
AI Key Findings
Generated Jun 12, 2025
Methodology — What approach did the authors take?
ChartCitor is a multi-agent framework that uses LLM agents to perform chart-to-table extraction, answer reformulation, table augmentation, evidence retrieval through pre-filtering and re-ranking, and table-to-chart mapping for fine-grained bounding box citations in chart images.
Key Results — What are the main findings?
- ChartCitor outperforms existing baselines across different chart types.
- Qualitative user studies show increased user trust in Generative AI with enhanced explainability for LLM-assisted chart QA.
Significance — Why does this research matter?
This research is significant as it addresses the issue of hallucinations in LLMs for chart question-answering tasks, providing fine-grained visual evidence and improving user trust and productivity for professionals.
Technical Contribution — What is the technical contribution?
ChartCitor introduces a multi-agent framework that leverages LLMs for structured chart attribution, providing visual evidence through bounding box annotations.
Novelty — What is new about this work?
ChartCitor's novelty lies in its multi-agent approach, addressing the fine-grained structured chart attribution task by orchestrating multiple LLM agents to extract structured data tables, reformulate answers, generate contextual descriptions, identify supporting evidence, and localize selected cells in chart images.
Limitations — What are the limitations of this study?
- The paper does not discuss potential limitations or challenges encountered during development or evaluation.
- No explicit mention of resource requirements or scalability issues.
Future Work — What did the authors propose for future work?
- Explore multi-chart interactions for more complex visual data.
- Investigate hallucination mitigation techniques for improved reliability.
How to Cite This Paper
@article{dernoncourt2025chartcitor,
title = {ChartCitor: Multi-Agent Framework for Fine-Grained Chart Visual
Attribution},
author = {Dernoncourt, Franck and Goswami, Kanika and Mathur, Puneet and others},
year = {2025},
eprint = {2502.00989},
archivePrefix = {arXiv},
primaryClass = {cs.CL},
}
Dernoncourt, F., Goswami, K., Mathur, P., & Rossi, R. (2025). ChartCitor: Multi-Agent Framework for Fine-Grained Chart Visual
Attribution. arXiv. https://arxiv.org/abs/2502.00989
Dernoncourt, Franck, et al. "ChartCitor: Multi-Agent Framework for Fine-Grained Chart Visual
Attribution." arXiv, 2025, arxiv.org/abs/2502.00989.
PDF Preview
Similar Papers
Found 4 papersTraceBack: Multi-Agent Decomposition for Fine-Grained Table Attribution
Tejas Anvekar, Junha Park, Rajat Jha et al.
ChartLens: Fine-grained Visual Attribution in Charts
Manan Suri, Puneet Mathur, Nedim Lipka et al.
EnergAt: Fine-Grained Energy Attribution for Multi-Tenancy
Hongyu Hè, Michal Friedman, Theodoros Rekatsinas
Chart-FR1: Visual Focus-Driven Fine-Grained Reasoning on Dense Charts
Hongkun Pan, Yuwei Wu, Wanyi Hong et al.
No citations found for this paper.
Comments (0)