Authors
Summary
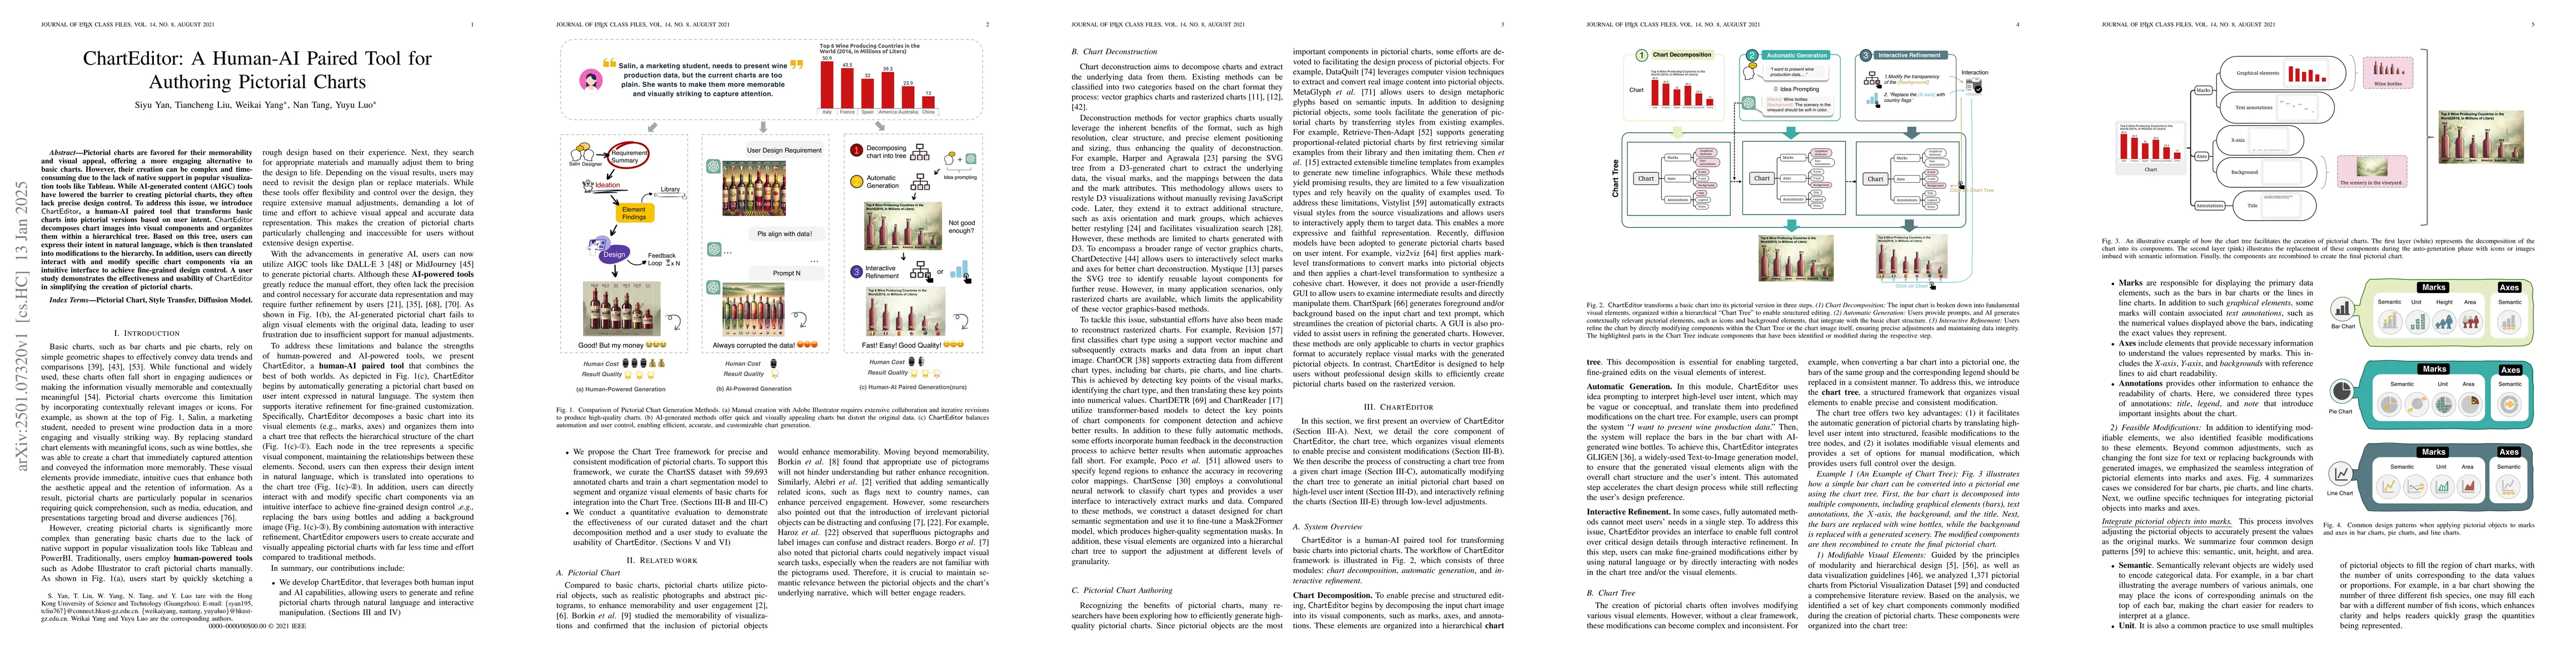
Pictorial charts are favored for their memorability and visual appeal, offering a more engaging alternative to basic charts. However, their creation can be complex and time-consuming due to the lack of native support in popular visualization tools like Tableau. While AI-generated content (AIGC) tools have lowered the barrier to creating pictorial charts, they often lack precise design control. To address this issue, we introduce ChartEditor, a human-AI paired tool that transforms basic charts into pictorial versions based on user intent. ChartEditor decomposes chart images into visual components and organizes them within a hierarchical tree. Based on this tree, users can express their intent in natural language, which is then translated into modifications to the hierarchy. In addition, users can directly interact with and modify specific chart components via an intuitive interface to achieve fine-grained design control. A user study demonstrates the effectiveness and usability of ChartEditor in simplifying the creation of pictorial charts.
AI Key Findings
Get AI-generated insights about this paper's methodology, results, and significance.
Paper Details
PDF Preview
Similar Papers
Found 4 papersPluto: Authoring Semantically Aligned Text and Charts for Data-Driven Communication
Arvind Satyanarayan, Arjun Srinivasan, Vidya Setlur
IntelliCircos: A Data-driven and AI-powered Authoring Tool for Circos Plots
Yong Wang, Min Zhu, Jiamin Zhu et al.
Authoring Worked Examples for Java Programming with Human-AI Collaboration
Mohammad Hassany, Peter Brusilovsky, Jiaze Ke et al.
No citations found for this paper.
Comments (0)