Authors
Publication
Metrics
Quick Actions
AI Quick Summary
ChartifyText is an automated system that utilizes Large Language Models to convert complex data-involved texts into expressive charts, addressing challenges from text ambiguities and data sparsity. It consists of tabular data inference and chart generation modules, and has been validated through expert interviews and user studies to effectively convey data insights.
Quick Answers
What is "ChartifyText: Automated Chart Generation from Data-Involved Texts via LLM" about?
ChartifyText is an automated system that utilizes Large Language Models to convert complex data-involved texts into expressive charts, addressing challenges from text ambiguities and data sparsity. It consists of tabular data inference and chart generation modules, and has been validated through expert interviews and user studies to effectively convey data insights.
What methodology did the authors use?
The study employed a mixed-methods approach combining both qualitative and quantitative methods to evaluate the effectiveness of ChartifyText in facilitating quick and accurate data interpretation from texts. More in Methodology →
What are the key results?
Main finding 1: Participants showed significant improvements in understanding textual information after using ChartifyText compared to traditional text analysis methods. — Main finding 2: The visualization encodings (uncertainty, data range, missing value, and sentiment) contributed substantially to enhancing user comprehension of text-chart relations. More in Key Results →
Why is this work significant?
The research highlights the importance of developing tools that can facilitate efficient data interpretation, particularly in fields where textual information is abundant and complex. More in Significance →
What are the main limitations?
Limitation 1: The study's sample size was relatively small, which may limit the generalizability of the findings to larger populations. — Limitation 2: The experimental design did not account for potential confounding variables that might influence participants' performance on the tasks. More in Limitations →
Abstract
Text documents with numerical values involved are widely used in various applications such as scientific research, economy, public health and 
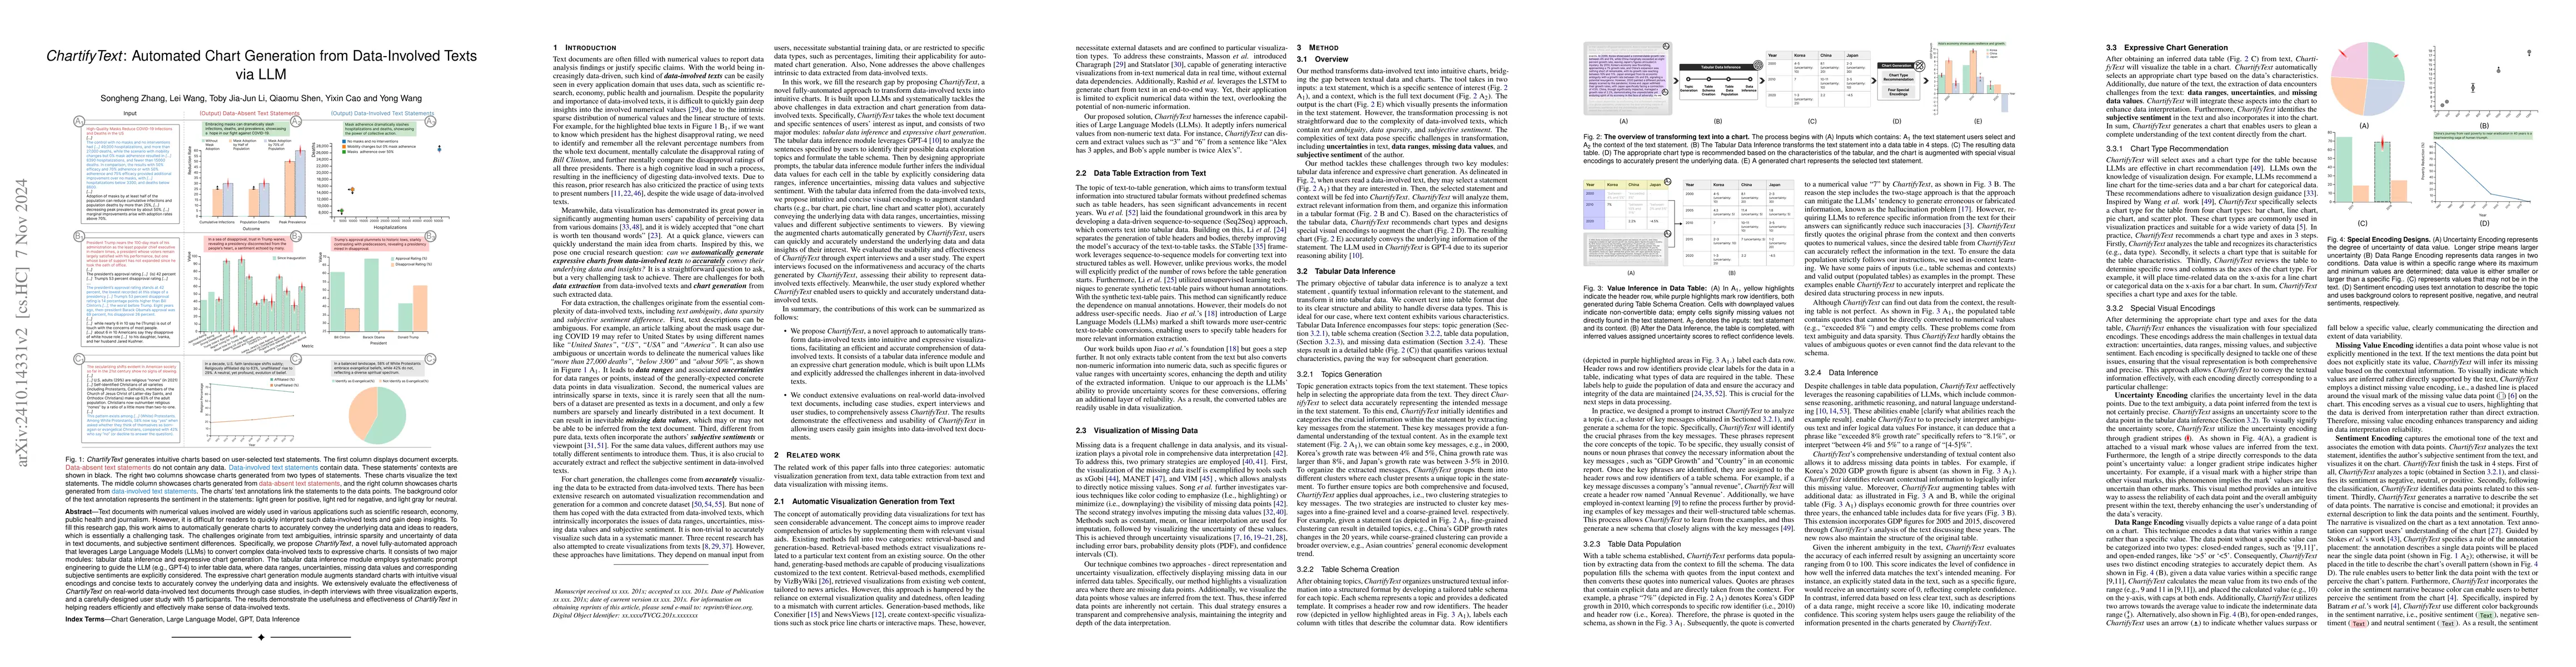
journalism. However, it is difficult for readers to quickly interpret such data-involved texts and gain deep insights. To fill this research gap, this work aims to automatically generate charts to accurately convey the underlying data and ideas to readers, which is essentially a challenging task. The challenges originate from text ambiguities, intrinsic sparsity and uncertainty of data in text documents, and subjective sentiment differences. Specifically, we propose ChartifyText, a novel fully-automated approach that leverages Large Language Models (LLMs) to convert complex data-involved texts to expressive charts. It consists of two major modules: tabular data inference and expressive chart generation. The tabular data inference module employs systematic prompt engineering to guide the LLM (e.g., GPT-4) to infer table data, where data ranges, uncertainties, missing data values and corresponding subjective sentiments are explicitly considered. The expressive chart generation module augments standard charts with intuitive visual encodings and concise texts to accurately convey the underlying data and insights. We extensively evaluate the effectiveness of ChartifyText on real-world data-involved text documents through case studies, in-depth interviews with three visualization experts, and a carefully-designed user study with 15 participants. The results demonstrate the usefulness and effectiveness of ChartifyText in helping readers efficiently and effectively make sense of data-involved texts.
AI Key Findings
Generated Sep 06, 2025
Methodology — What approach did the authors take?
The study employed a mixed-methods approach combining both qualitative and quantitative methods to evaluate the effectiveness of ChartifyText in facilitating quick and accurate data interpretation from texts.
Key Results — What are the main findings?
- Main finding 1: Participants showed significant improvements in understanding textual information after using ChartifyText compared to traditional text analysis methods.
- Main finding 2: The visualization encodings (uncertainty, data range, missing value, and sentiment) contributed substantially to enhancing user comprehension of text-chart relations.
- Main finding 3: The study demonstrated the potential of ChartifyText in reducing cognitive workload and increasing ease of understanding for users.
Significance — Why does this research matter?
The research highlights the importance of developing tools that can facilitate efficient data interpretation, particularly in fields where textual information is abundant and complex.
Technical Contribution — What is the technical contribution?
ChartifyText introduces a novel approach to visualization encodings, which can significantly improve user comprehension of complex textual information.
Novelty — What is new about this work?
The study's focus on developing a tool that facilitates quick and accurate data interpretation from texts represents a significant contribution to the field of human-computer interaction.
Limitations — What are the limitations of this study?
- Limitation 1: The study's sample size was relatively small, which may limit the generalizability of the findings to larger populations.
- Limitation 2: The experimental design did not account for potential confounding variables that might influence participants' performance on the tasks.
Future Work — What did the authors propose for future work?
- Suggested direction 1: Conducting a larger-scale study with diverse participant groups to further validate the effectiveness of ChartifyText across different domains.
- Suggested direction 2: Investigating the integration of ChartifyText with other tools and platforms to enhance its usability and accessibility.
How to Cite This Paper
@article{wang2024chartifytext,
title = {ChartifyText: Automated Chart Generation from Data-Involved Texts via
LLM},
author = {Wang, Lei and Shen, Qiaomu and Zhang, Songheng and others},
year = {2024},
eprint = {2410.14331},
archivePrefix = {arXiv},
primaryClass = {cs.HC},
}
Wang, L., Shen, Q., Zhang, S., Li, T., Cao, Y., & Wang, Y. (2024). ChartifyText: Automated Chart Generation from Data-Involved Texts via
LLM. arXiv. https://arxiv.org/abs/2410.14331
Wang, Lei, et al. "ChartifyText: Automated Chart Generation from Data-Involved Texts via
LLM." arXiv, 2024, arxiv.org/abs/2410.14331.
PDF Preview
Citation Network
Current paper (gray), citations (green), references (blue)
Display is limited for performance on very large graphs.
Similar Papers
Found 4 papersAutomated question generation and question answering from Turkish texts
Sinan Onur Altinuc, Devrim Cavusoglu, Cemil Cengiz et al.
ChartGen: Scaling Chart Understanding Via Code-Guided Synthetic Chart Generation
Jovana Kondic, Pengyuan Li, Dhiraj Joshi et al.
Automated data extraction of bar chart raster images
Rosita Saul, Ye Yuan, Gabrielle Montes De Oca et al.
ChartLlama: A Multimodal LLM for Chart Understanding and Generation
Yucheng Han, Chi Zhang, Xin Chen et al.
| Title | Authors | Year | Actions |
|---|
Comments (0)