ChartInsighter: An Approach for Mitigating Hallucination in Time-series Chart Summary Generation with A Benchmark Dataset
Publication
Metrics
AI Quick Summary
ChartInsighter mitigates hallucinations in time-series chart summary generation by employing multiple agents and external analysis modules to collaboratively produce accurate summaries, validated through self-consistency tests. A new benchmark dataset with annotated hallucination types demonstrates the method's superior performance in reducing hallucinations compared to existing models.
Paper Preview
Abstract
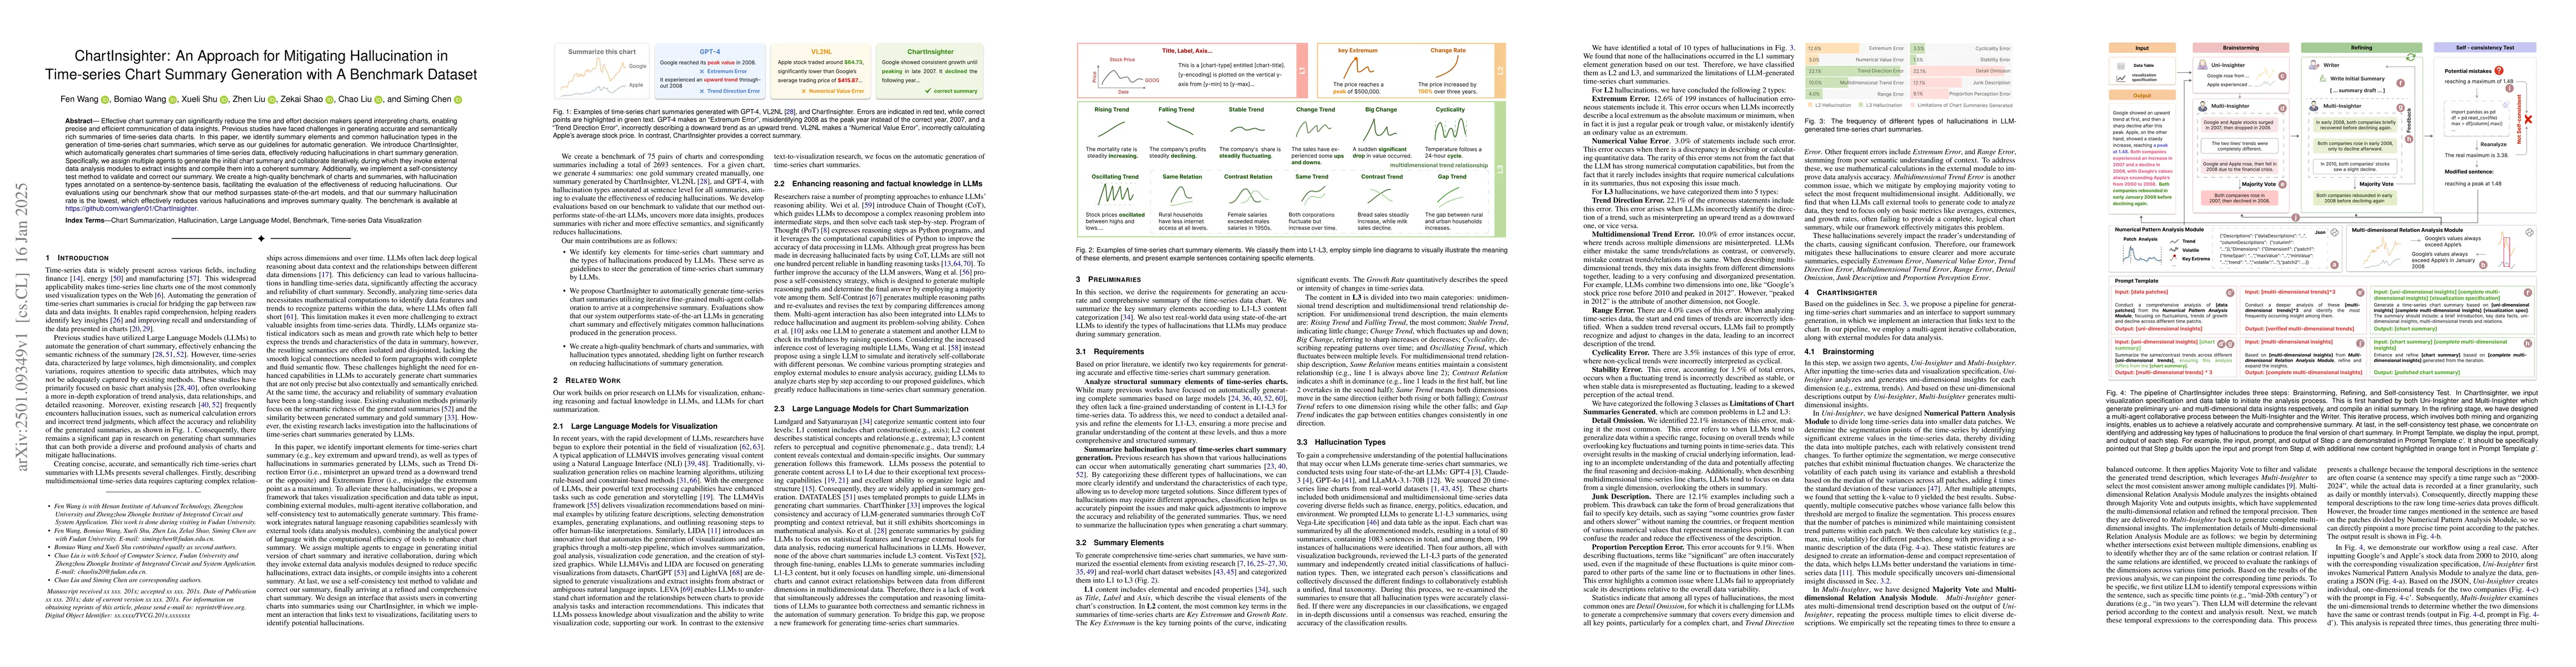
Effective chart summary can significantly reduce the time and effort decision makers spend interpreting charts, enabling precise and efficient communication of data insights. Previous studies have faced challenges in generating accurate and semantically rich summaries of time-series data charts. In this paper, we identify summary elements and common hallucination types in the generation of time-series chart summaries, which serve as our guidelines for automatic generation. We introduce ChartInsighter, which automatically generates chart summaries of time-series data, effectively reducing hallucinations in chart summary generation. Specifically, we assign multiple agents to generate the initial chart summary and collaborate iteratively, during which they invoke external data analysis modules to extract insights and compile them into a coherent summary. Additionally, we implement a self-consistency test method to validate and correct our summary. We create a high-quality benchmark of charts and summaries, with hallucination types annotated on a sentence-by-sentence basis, facilitating the evaluation of the effectiveness of reducing hallucinations. Our evaluations using our benchmark show that our method surpasses state-of-the-art models, and that our summary hallucination rate is the lowest, which effectively reduces various hallucinations and improves summary quality. The benchmark is available at https://github.com/wangfen01/ChartInsighter.
AI Key Findings
Get AI-generated insights about this paper's methodology, results, significance, and more — seven facets brought into focus.
Authors
PDF Preview
Related Papers
No references found for this paper.
Discussion 0