The paper introduces Chartist, a computational model that simulates eye movements for chart reading tasks using a two-level hierarchical control architecture. High-level controllers utilize LLMs to comprehend gathered information and select goals, while lower-level controllers move eyes according to a reinforcement learning-derived sampling policy.
Chartist: Task-driven Eye Movement Control for Chart Reading
Publication
Metrics
AI Quick Summary
Chartist is a computational model that simulates task-driven eye movements for chart reading, employing a two-level hierarchical control architecture with LLMs and reinforcement learning to predict human-like scanpaths. Despite limitations, it advances understanding of human-chart interaction for applications in explainable AI and visualization design.
Quick Answers
What is "Chartist: Task-driven Eye Movement Control for Chart Reading" about?
Chartist is a computational model that simulates task-driven eye movements for chart reading, employing a two-level hierarchical control architecture with LLMs and reinforcement learning to predict human-like scanpaths. Despite limitations, it advances understanding of human-chart interaction for applications in explainable AI and visualization design.
What methodology did the authors use?
The paper introduces Chartist, a computational model that simulates eye movements for chart reading tasks using a two-level hierarchical control architecture. High-level controllers utilize LLMs to comprehend gathered information and select goals, while lower-level controllers move eyes according to a reinforcement learning-derived sampling policy. More in Methodology →
What are the key results?
Chartist predicts human-like task-driven scanpaths for various chart analysis tasks, including value retrieval, filtering, and finding extremes. — The model demonstrates applicability in explainable AI, visualization design evaluation, and optimization. More in Key Results →
Why is this work significant?
This research is significant as it complements empirical studies on chart reading by offering estimates of user performance inexpensively, aiding in designing more comprehensible data visualizations. More in Significance →
What are the main limitations?
Chartist displays limitations in terms of generalizability and accuracy. — The model's performance may vary across diverse user groups and chart types. More in Limitations →
Abstract
To design data visualizations that are easy to comprehend, we need to understand how people with different interests read them. Computational models of predicting scanpaths on charts could complement empirical studies by offering estimates of user performance inexpensively; however, previous models have been limited to gaze patterns and overlooked the effects of tasks. Here, 
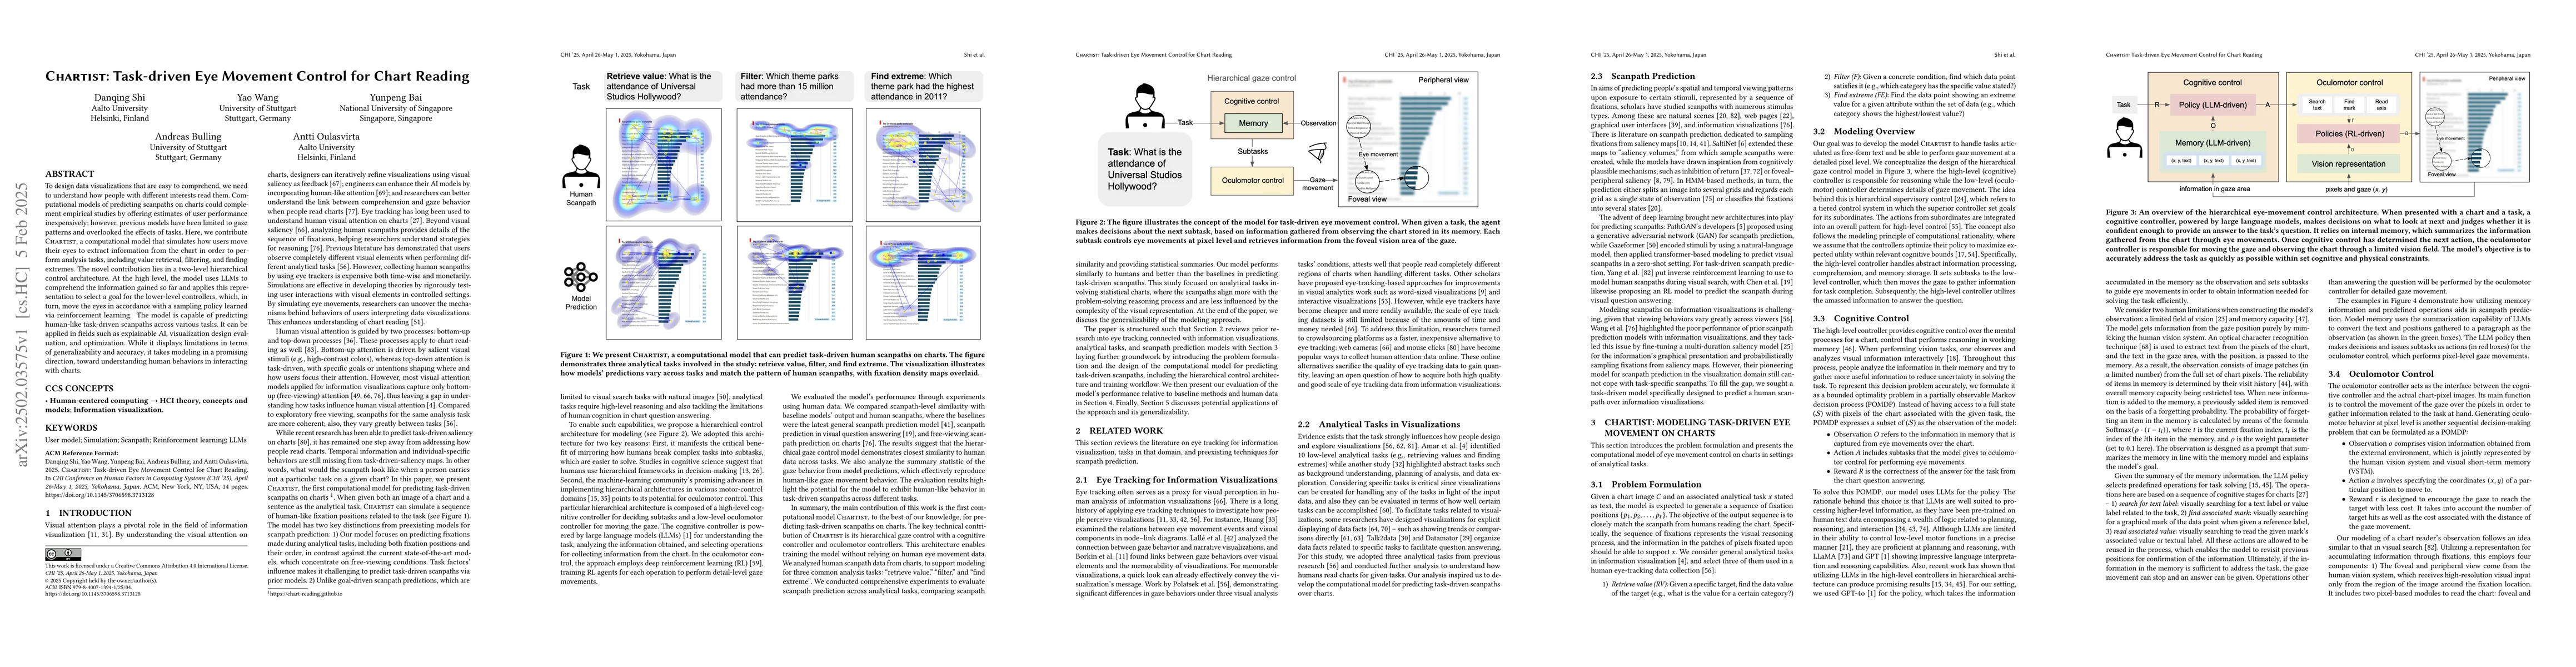
we contribute Chartist, a computational model that simulates how users move their eyes to extract information from the chart in order to perform analysis tasks, including value retrieval, filtering, and finding extremes. The novel contribution lies in a two-level hierarchical control architecture. At the high level, the model uses LLMs to comprehend the information gained so far and applies this representation to select a goal for the lower-level controllers, which, in turn, move the eyes in accordance with a sampling policy learned via reinforcement learning. The model is capable of predicting human-like task-driven scanpaths across various tasks. It can be applied in fields such as explainable AI, visualization design evaluation, and optimization. While it displays limitations in terms of generalizability and accuracy, it takes modeling in a promising direction, toward understanding human behaviors in interacting with charts.
Key Findings, in focus
Seven facets of this paper, analysed and brought into focus by AI.
This research is significant as it complements empirical studies on chart reading by offering estimates of user performance inexpensively, aiding in designing more comprehensible data visualizations.
- Chartist predicts human-like task-driven scanpaths for various chart analysis tasks, including value retrieval, filtering, and finding extremes.
- The model demonstrates applicability in explainable AI, visualization design evaluation, and optimization.
- It represents a step forward in understanding human behaviors while interacting with charts.
This research is significant as it complements empirical studies on chart reading by offering estimates of user performance inexpensively, aiding in designing more comprehensible data visualizations.
The two-level hierarchical control architecture combining high-level LLM-based comprehension and lower-level reinforcement learning-guided eye movement simulation.
Chartist distinguishes itself by integrating task-driven eye movement control with hierarchical architecture, incorporating both natural language understanding and reinforcement learning, unlike previous models focused solely on gaze patterns without task considerations.
- Chartist displays limitations in terms of generalizability and accuracy.
- The model's performance may vary across diverse user groups and chart types.
- Explore improvements in generalizability and accuracy to enhance model performance.
- Investigate the applicability of Chartist across a broader range of chart types and user demographics.
Impact
Authors
PDF Preview
Citation Network
Current paper (gray), citations (green), references (blue)
Display is limited for performance on very large graphs.
Discussion 0