Background
Chart reasoning remains a challenging frontier for vision-language models (VLMs). While recent VLMs exhibit impressive general reasoning, their performance on chart understanding lags due to two intertwined data bottlenecks: (i) synthetic charts often rely on simplistic, template-driven visual patterns that fail to capture real-world long-tail complexity, and (ii) QA supervision tends to be noisy or hallucination-prone when generated by large language models (LLMs) from images or captions alone. This leads to limited exposure to multi-step reasoning, brittle numerical accuracy, and poor generalization to diverse chart modalities. ChartVerse targets these gaps by proposing an end-to-end data synthesis framework that emphasizes visual complexity, distributional diversity, and rigorously ground-truth reasoning.
Problem / Research Question
The central question is how to synthesize large-scale, diverse, and genuinely hard chart reasoning data with reliable supervision to train open-source chart-reasoning models. Specifically, the work asks: how can we quantify chart difficulty, generate diverse and realistic charts from executable code, and guarantee the correctness of QA pairs without expensive manual verification? The research further investigates whether inverse QA synthesis, anchored to programmatic ground truth, can yield QA that meaningfully advances model reasoning across chart benchmarks and related STEM tasks.
Innovation / Contribution
ChartVerse delivers multiple innovations that address the core challenges:
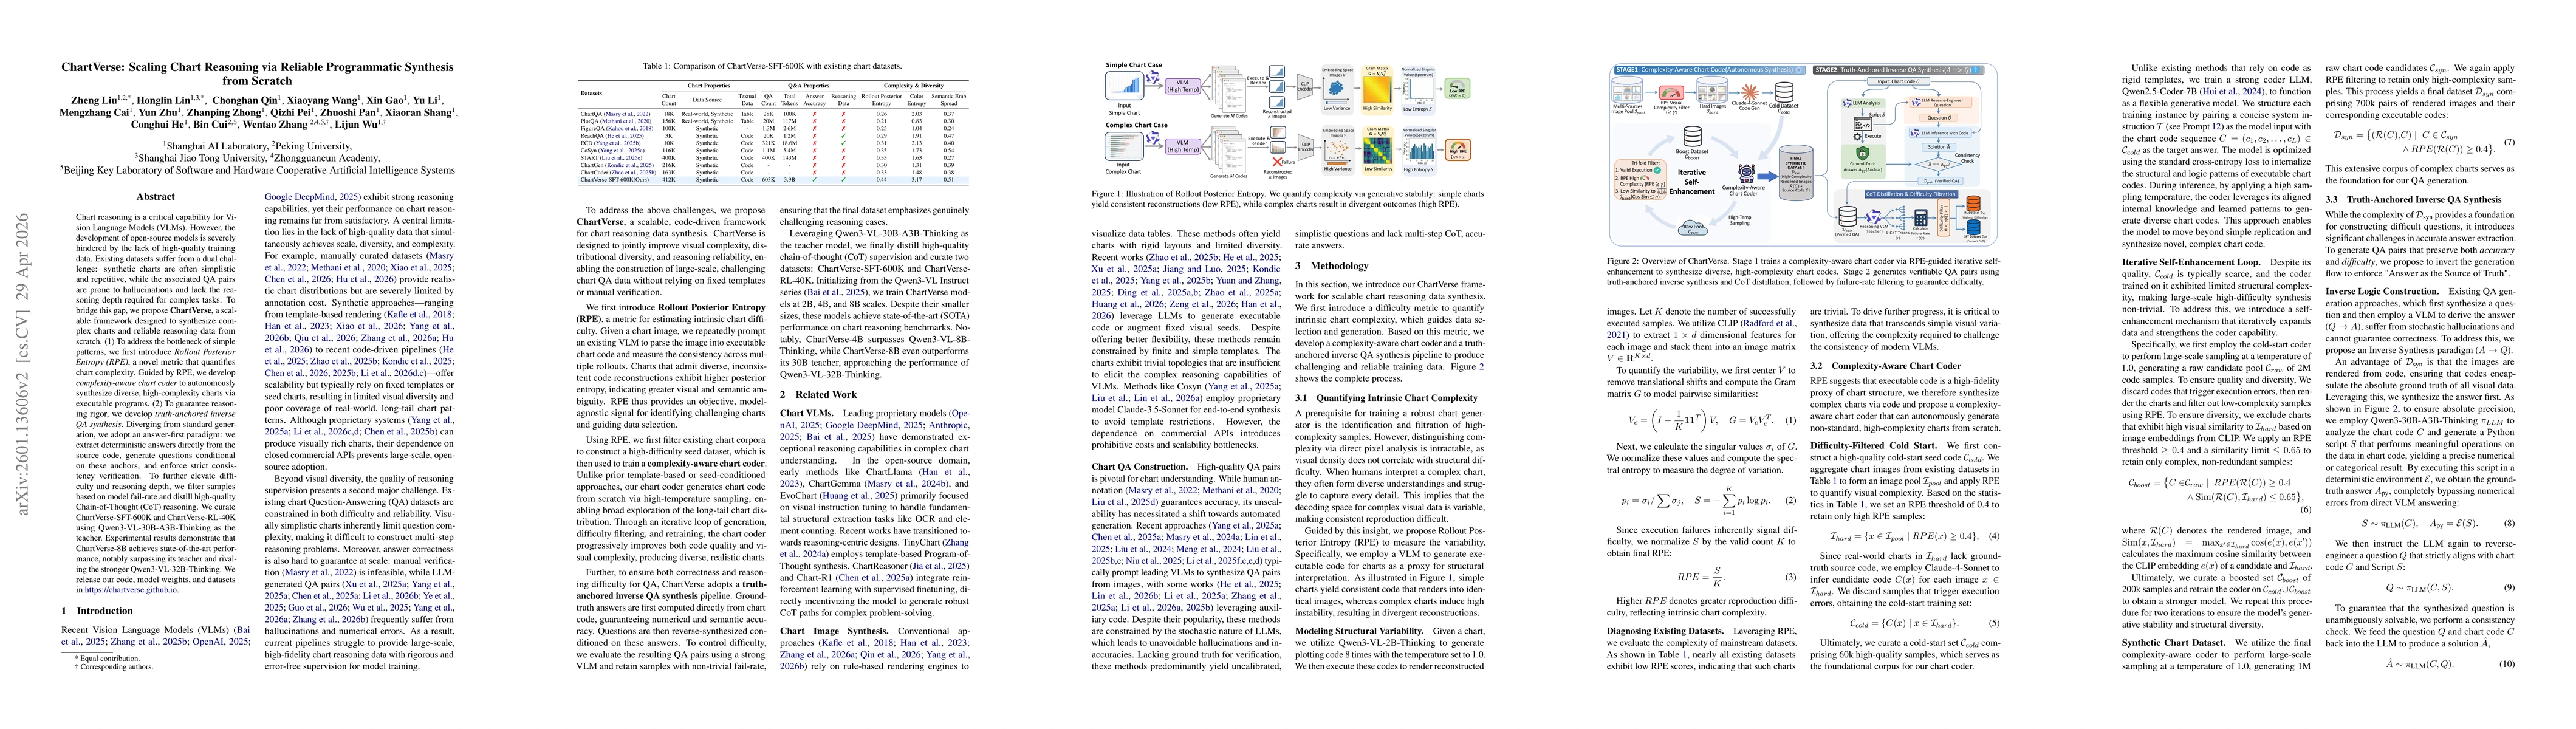
- Rollout Posterior Entropy (RPE): a metric that quantifies intrinsic chart difficulty by measuring the diversity of multiple code reconstructions that render the same chart image. High RPE signals visual and semantic ambiguity beyond surface features.
- Complexity-aware chart coder: trained to autonomously synthesize diverse, high-complexity chart codes that, when executed, render challenging visuals. The coder is trained first on a high-quality cold-start seed and then enhanced through iterative self-improvement guided by RPE.
- Truth-anchored inverse QA synthesis: an answer-first generation pipeline where ground-truth answers are computed from chart code via deterministic Python scripts; questions are then reverse-engineered to tightly align with the ground truth, with consistency checks to ensure solvability.
- CoT distillation and failure-rate filtering: to encourage deeper reasoning, ChartVerse distills chain-of-thought traces from a strong teacher and filters for hard samples using model fail-rate, improving downstream learning signals.
- Large-scale, open training data: ChartVerse-SFT-600K and ChartVerse-RL-40K, created from a 900k-strong synthetic corpus, enabling robust training of 2B/4B/8B chart-aware models that outperform chart-specific baselines and rival the stronger instruction-tuned models.
Methodology / Approach
The synthesis pipeline proceeds in two stages. Stage 1 builds a complexity-aware chart coder. It starts with a cold-start dataset comprising 60k high-quality samples (Ccold), assembled by collecting images from existing chart corpora and using a ground-truth inference step to approximate code (C(x)) via Claude-4-Sonnet. This seed enables training a flexible coder (Qwen2.5Coder-7B) with a concise system prompt, learning to generate executable chart code. Through two self-enhancement iterations, the coder samples large code pools (Craw ≈ 2M), renders charts, and applies RPE-based filtering (RPE ≥ 0.4; visual similarity threshold ≤ 0.65) to ensure both complexity and diversity, yielding a final complex coder capable of generating 1.2M candidate codes (Csyn) and, after filtering, a final Dsyn consisting of about 900k image–code pairs.
Stage 2 generates verifiable QA data via inverse synthesis. Ground-truth answers come from deterministic execution of Python scripts S that operate on chart data, guaranteeing exact numerical or categorical results. A reverse QA step then crafts questions Q that align with the code C and the computed outputs, and a consistency check discards mismatches. This textual, ground-truth–anchored QA construction operates entirely in text, avoiding visual encoding errors and enabling scalable, reliable supervision.
The training pipeline integrates a teacher–student paradigm. The robust teacher model Qwen3-VL-30B-A3B-Thinking provides high-quality CoT traces for distillation, yielding ChartVerse-SFT-600K and ChartVerse-RL-40K. Fine-tuning uses LLaMA-Factory and Verl, distributed over a multi-node GPU cluster. The evaluation framework replaces exact-match metrics with a compass-verifier-based judge to assess correctness of responses in long-form reasoning tasks, while enabling long-context reasoning through extended token windows.
Experiments / Evaluation
ChartVerse evaluates across six specialized chart benchmarks: ChartQA-Pro, CharXiv (RQ, DQ), ChartMuseum, ChartX, and EvoChart, plus STEM-oriented datasets. Across model scales, ChartVerse-SFT significantly improves over baseline instruction-tuned charts, and ChartVerse-RL yields additional gains by prioritizing harder samples. Notably, ChartVerse-2B, -4B, and -8B show a monotonic performance lift, with ChartVerse-8B approaching the capabilities of larger teacher models (e.g., Qwen3-VL-32B-Thinking) and even surpassing its own teacher in some settings. In ablation studies, truth-anchored QA with fail-rate filtering delivers larger gains than image-space or codespace generation alone, underscoring the value of a ground-truth–anchored, hard-sample focused supervision signal.
Beyond chart-specific gains, ChartVerse improves open-model performance on STEM reasoning benchmarks such as MathVista, DynaMath, MathVerse, LogicVista, and VisuLogic, demonstrating that the benefits of complexity-aware, code-driven data synthesis transfer to broader multi-modal reasoning tasks.
Key Results
Key empirical takeaways include: (i) ChartVerse-8B achieves the strongest average scores on chart benchmarks, surpassing several baselines and rivaling larger teacher models; (ii) ChartVerse-SFT provides substantial gains over baselines at fixed data budgets, indicating that data quality and task structure drive performance more than sheer scale; (iii) RPE-based data selection yields notably harder samples, translating to better downstream accuracy and robust reasoning capabilities; (iv) the inverse QA pipeline ensures ground-truth-aligned QA pairs, reducing numerical and logical inconsistencies common in image-based generation.
Practical Applications
The ChartVerse framework offers a practical, open-path to high-quality chart reasoning data and models. By emphasizing complexity-aware chart generation and truth-anchored QA, it lowers the barrier to training capable chart-reasoning models with mid-sized architectures. The open data pipeline (900k chart–code pairs; ChartVerse-SFT-600K; ChartVerse-RL-40K) can be repurposed to bootstrap chart understanding in diverse domains, from finance dashboards to scientific visualizations, and could inspire similar approaches for other structured-data reasoning tasks beyond charts.
Limitations & Considerations
While compelling, the approach relies on substantial compute for data generation (millions of LLM inferences and multi-node training) and on the quality of source code-based ground truth. Generalization to entirely new chart families or to non-chart visual reasoning domains remains to be empirically tested. The RPE thresholds and similarity constraints are design choices that may require tuning for different corpora or chart styles. Finally, while the inverse QA pipeline reduces hallucinations, it presupposes that the code can faithfully capture all visual details, which may not hold for highly exotic layouts or user-generated charts with unconventional encodings.
Discussion 0