CIER: A Novel Experience Replay Approach with Causal Inference in Deep Reinforcement Learning
Publication
Metrics
AI Quick Summary
This paper proposes CIER, a novel experience replay approach that segments multivariate time series into meaningful subsequences for better data utilization in Deep Reinforcement Learning (DRL). It incorporates causal inference to identify key factors impacting training outcomes, enhancing both the effectiveness and explainability of DRL training.
Paper Preview
Abstract
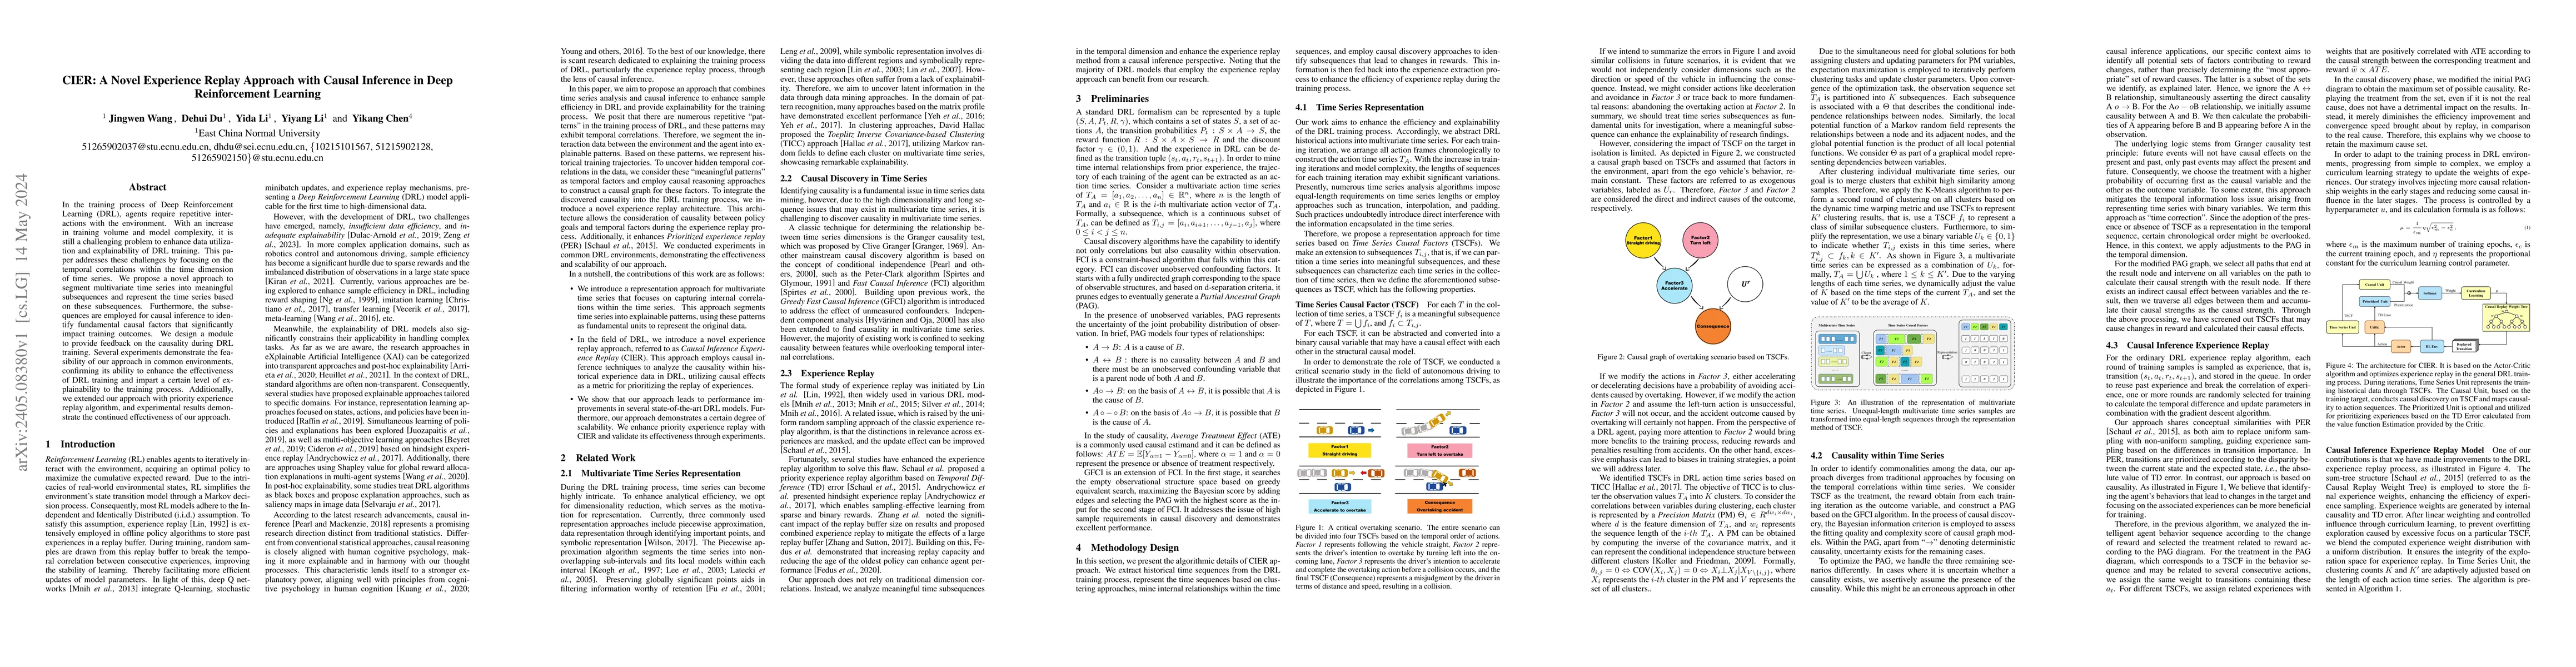
In the training process of Deep Reinforcement Learning (DRL), agents require repetitive interactions with the environment. With an increase in training volume and model complexity, it is still a challenging problem to enhance data utilization and explainability of DRL training. This paper addresses these challenges by focusing on the temporal correlations within the time dimension of time series. We propose a novel approach to segment multivariate time series into meaningful subsequences and represent the time series based on these subsequences. Furthermore, the subsequences are employed for causal inference to identify fundamental causal factors that significantly impact training outcomes. We design a module to provide feedback on the causality during DRL training. Several experiments demonstrate the feasibility of our approach in common environments, confirming its ability to enhance the effectiveness of DRL training and impart a certain level of explainability to the training process. Additionally, we extended our approach with priority experience replay algorithm, and experimental results demonstrate the continued effectiveness of our approach.
AI Key Findings
Get AI-generated insights about this paper's methodology, results, significance, and more — seven facets brought into focus.
Impact
Paper Details
Authors
PDF Preview
Key Terms
Citation Network
Current paper (gray), citations (green), references (blue)
Display is limited for performance on very large graphs.
Discussion 0