Summary
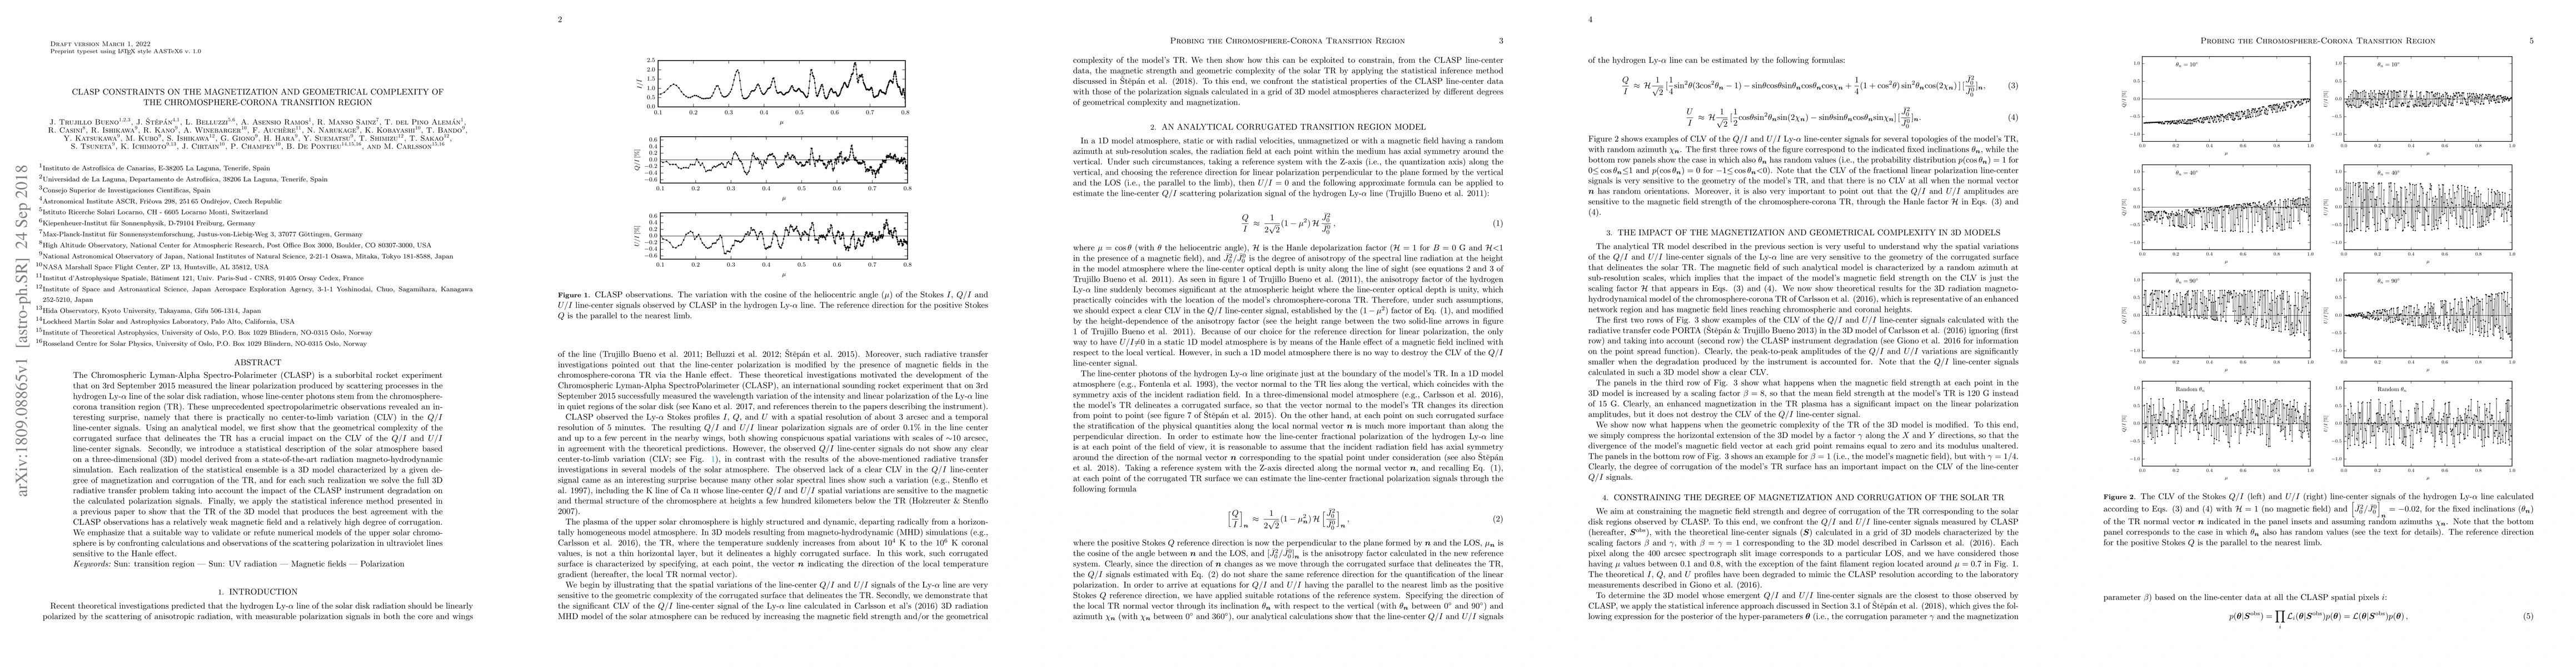
The Chromospheric Lyman-Alpha Spectro-Polarimeter (CLASP) is a suborbital rocket experiment that on 3rd September 2015 measured the linear polarization produced by scattering processes in the hydrogen Ly-$\alpha$ line of the solar disk radiation, whose line-center photons stem from the chromosphere-corona transition region (TR). These unprecedented spectropolarimetric observations revealed an interesting surprise, namely that there is practically no center-to-limb variation (CLV) in the $Q/I$ line-center signals. Using an analytical model, we first show that the geometrical complexity of the corrugated surface that delineates the TR has a crucial impact on the CLV of the $Q/I$ and $U/I$ line-center signals. Secondly, we introduce a statistical description of the solar atmosphere based on a three-dimensional (3D) model derived from a state-of-the-art radiation magneto-hydrodynamic simulation. Each realization of the statistical ensemble is a 3D model characterized by a given degree of magnetization and corrugation of the TR, and for each such realization we solve the full 3D radiative transfer problem taking into account the impact of the CLASP instrument degradation on the calculated polarization signals. Finally, we apply the statistical inference method presented in a previous paper to show that the TR of the 3D model that produces the best agreement with the CLASP observations has a relatively weak magnetic field and a relatively high degree of corrugation. We emphasize that a suitable way to validate or refute numerical models of the upper solar chromosphere is by confronting calculations and observations of the scattering polarization in ultraviolet lines sensitive to the Hanle effect.
AI Key Findings
Get AI-generated insights about this paper's methodology, results, and significance.
Paper Details
PDF Preview
Key Terms
Citation Network
Current paper (gray), citations (green), references (blue)
Display is limited for performance on very large graphs.
Similar Papers
Found 4 papersOn the Response of the Transition Region and the Corona to Rapid Excursions in the Chromosphere
T. M. D. Pereira, S. K. Mathew, Ravi Chaurasiya et al.
| Title | Authors | Year | Actions |
|---|
Comments (0)