Class-Based Time Series Data Augmentation to Mitigate Extreme Class Imbalance for Solar Flare Prediction
Publication
Metrics
AI Quick Summary
This paper introduces Mean Gaussian Noise (MGN) as a novel data augmentation method to mitigate class imbalance in time series data, specifically for solar flare prediction. The proposed method is shown to outperform eight existing augmentation techniques in enhancing classification performance, with competitive computational efficiency.
Paper Preview
Abstract
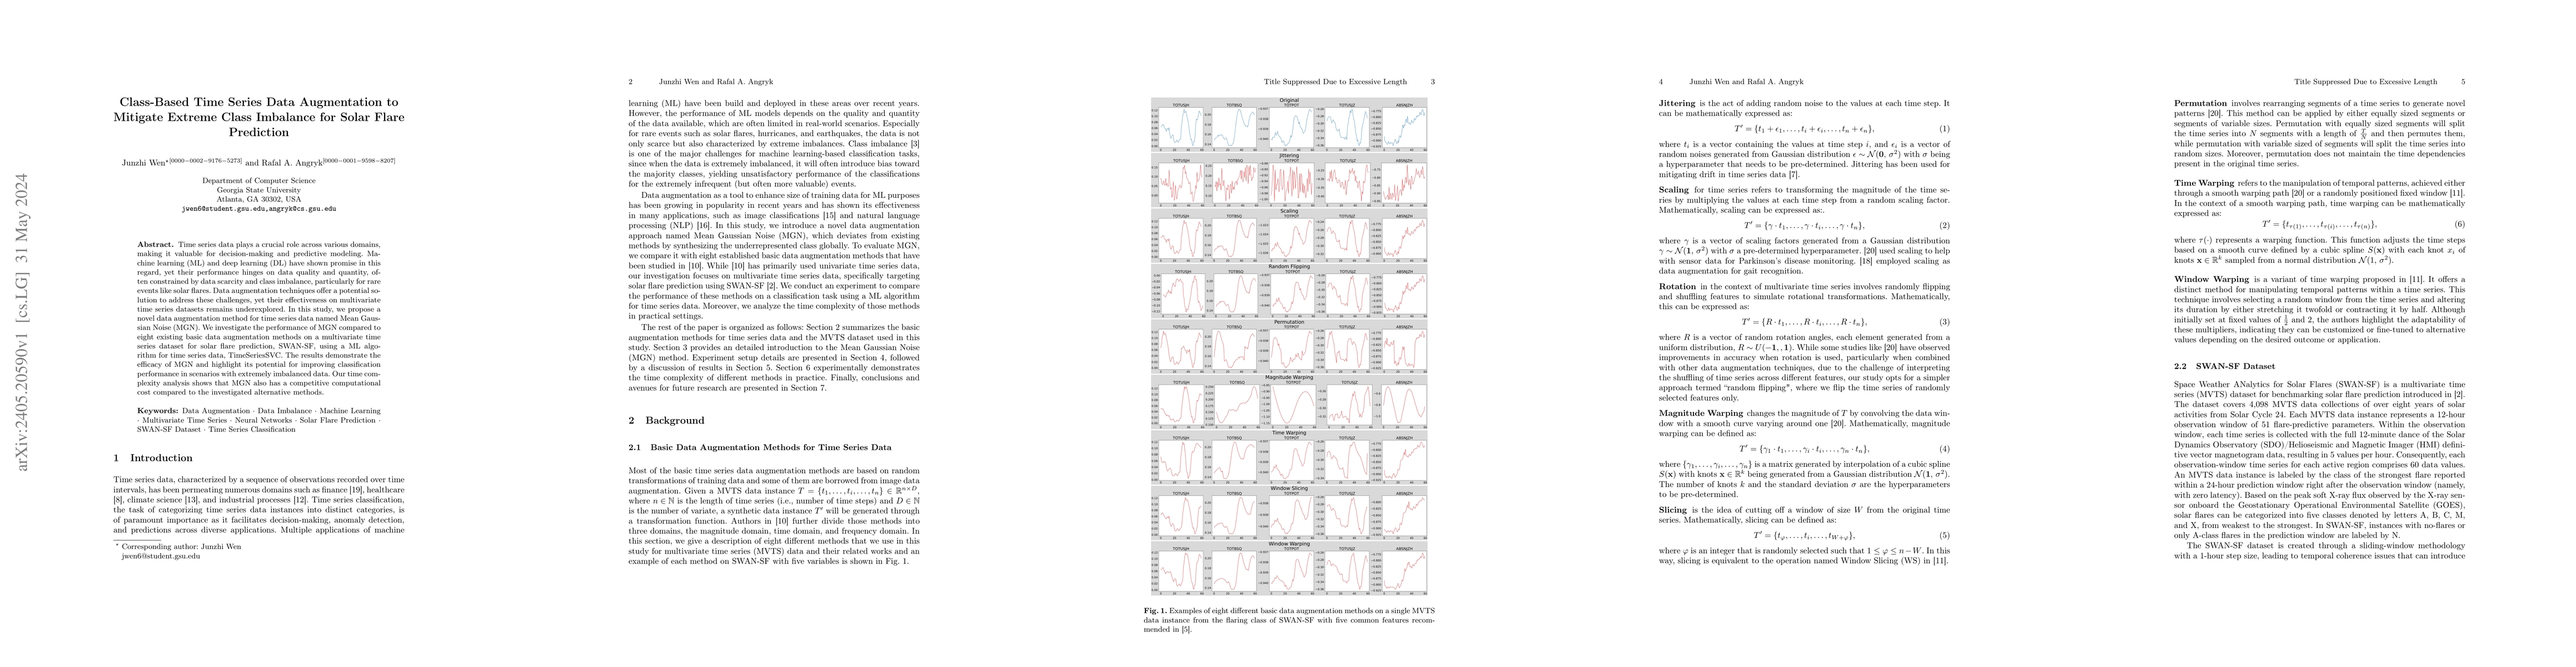
Time series data plays a crucial role across various domains, making it valuable for decision-making and predictive modeling. Machine learning (ML) and deep learning (DL) have shown promise in this regard, yet their performance hinges on data quality and quantity, often constrained by data scarcity and class imbalance, particularly for rare events like solar flares. Data augmentation techniques offer a potential solution to address these challenges, yet their effectiveness on multivariate time series datasets remains underexplored. In this study, we propose a novel data augmentation method for time series data named Mean Gaussian Noise (MGN). We investigate the performance of MGN compared to eight existing basic data augmentation methods on a multivariate time series dataset for solar flare prediction, SWAN-SF, using a ML algorithm for time series data, TimeSeriesSVC. The results demonstrate the efficacy of MGN and highlight its potential for improving classification performance in scenarios with extremely imbalanced data. Our time complexity analysis shows that MGN also has a competitive computational cost compared to the investigated alternative methods.
AI Key Findings
Get AI-generated insights about this paper's methodology, results, significance, and more — seven facets brought into focus.
Impact
Paper Details
Authors
PDF Preview
Key Terms
Citation Network
Current paper (gray), citations (green), references (blue)
Display is limited for performance on very large graphs.
Discussion 0