Class Specific Feature Selection for Interval Valued Data Through Interval K-Means Clustering
Publication
Metrics
AI Quick Summary
This paper proposes a novel feature selection method for interval valued data using interval K-Means clustering, which identifies class-specific features by clustering features into K distinct groups for each class. The method outperforms existing state-of-the-art techniques on four standard datasets.
Paper Preview
Abstract
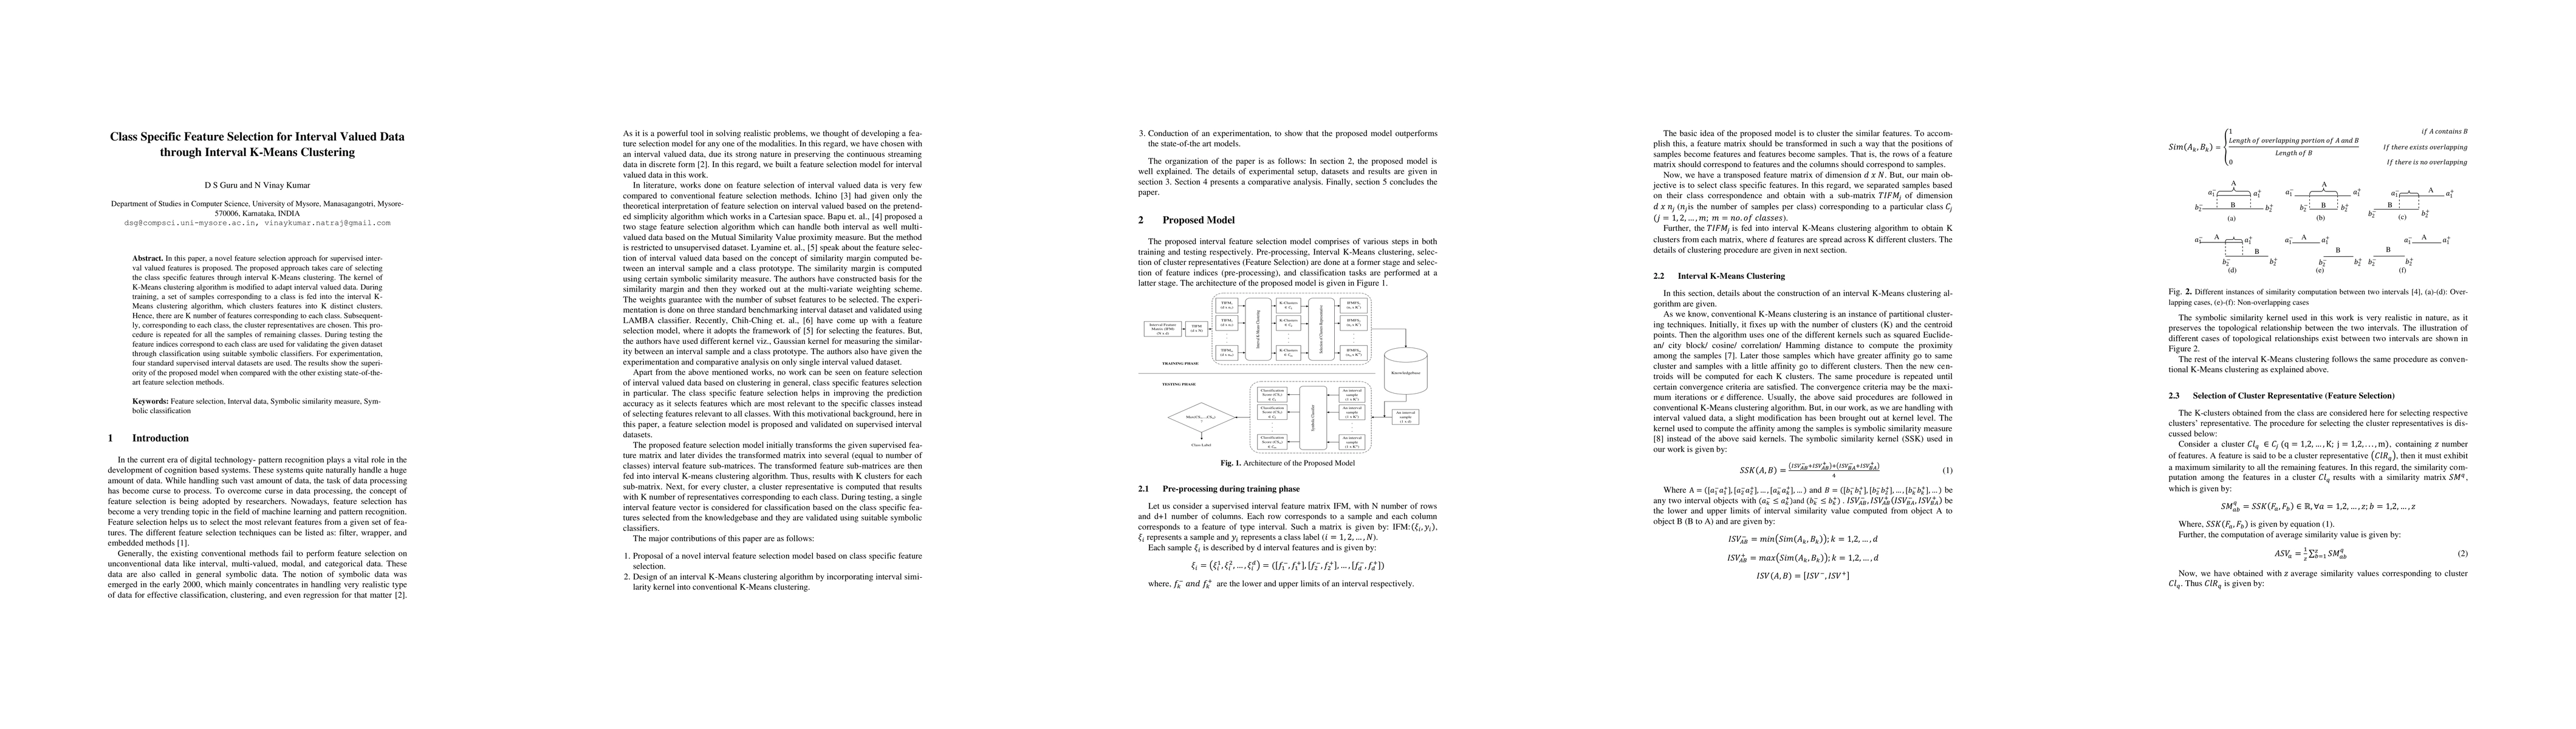
In this paper, a novel feature selection approach for supervised interval valued features is proposed. The proposed approach takes care of selecting the class specific features through interval K-Means clustering. The kernel of K-Means clustering algorithm is modified to adapt interval valued data. During training, a set of samples corresponding to a class is fed into the interval K-Means clustering algorithm, which clusters features into K distinct clusters. Hence, there are K number of features corresponding to each class. Subsequently, corresponding to each class, the cluster representatives are chosen. This procedure is repeated for all the samples of remaining classes. During testing the feature indices correspond to each class are used for validating the given dataset through classification using suitable symbolic classifiers. For experimentation, four standard supervised interval datasets are used. The results show the superiority of the proposed model when compared with the other existing state-of-the-art feature selection methods.
AI Key Findings
Get AI-generated insights about this paper's methodology, results, significance, and more — seven facets brought into focus.
Impact
Paper Details
PDF Preview
Key Terms
Citation Network
Current paper (gray), citations (green), references (blue)
Display is limited for performance on very large graphs.
Related Papers
No references found for this paper.
Discussion 0