Publication
Metrics
AI Quick Summary
Researchers analyzed emission line ratios in 533 galaxies at z~1.5 to understand galaxy evolution, finding that a new diagram is useful for identifying AGN content.
Paper Preview
Abstract
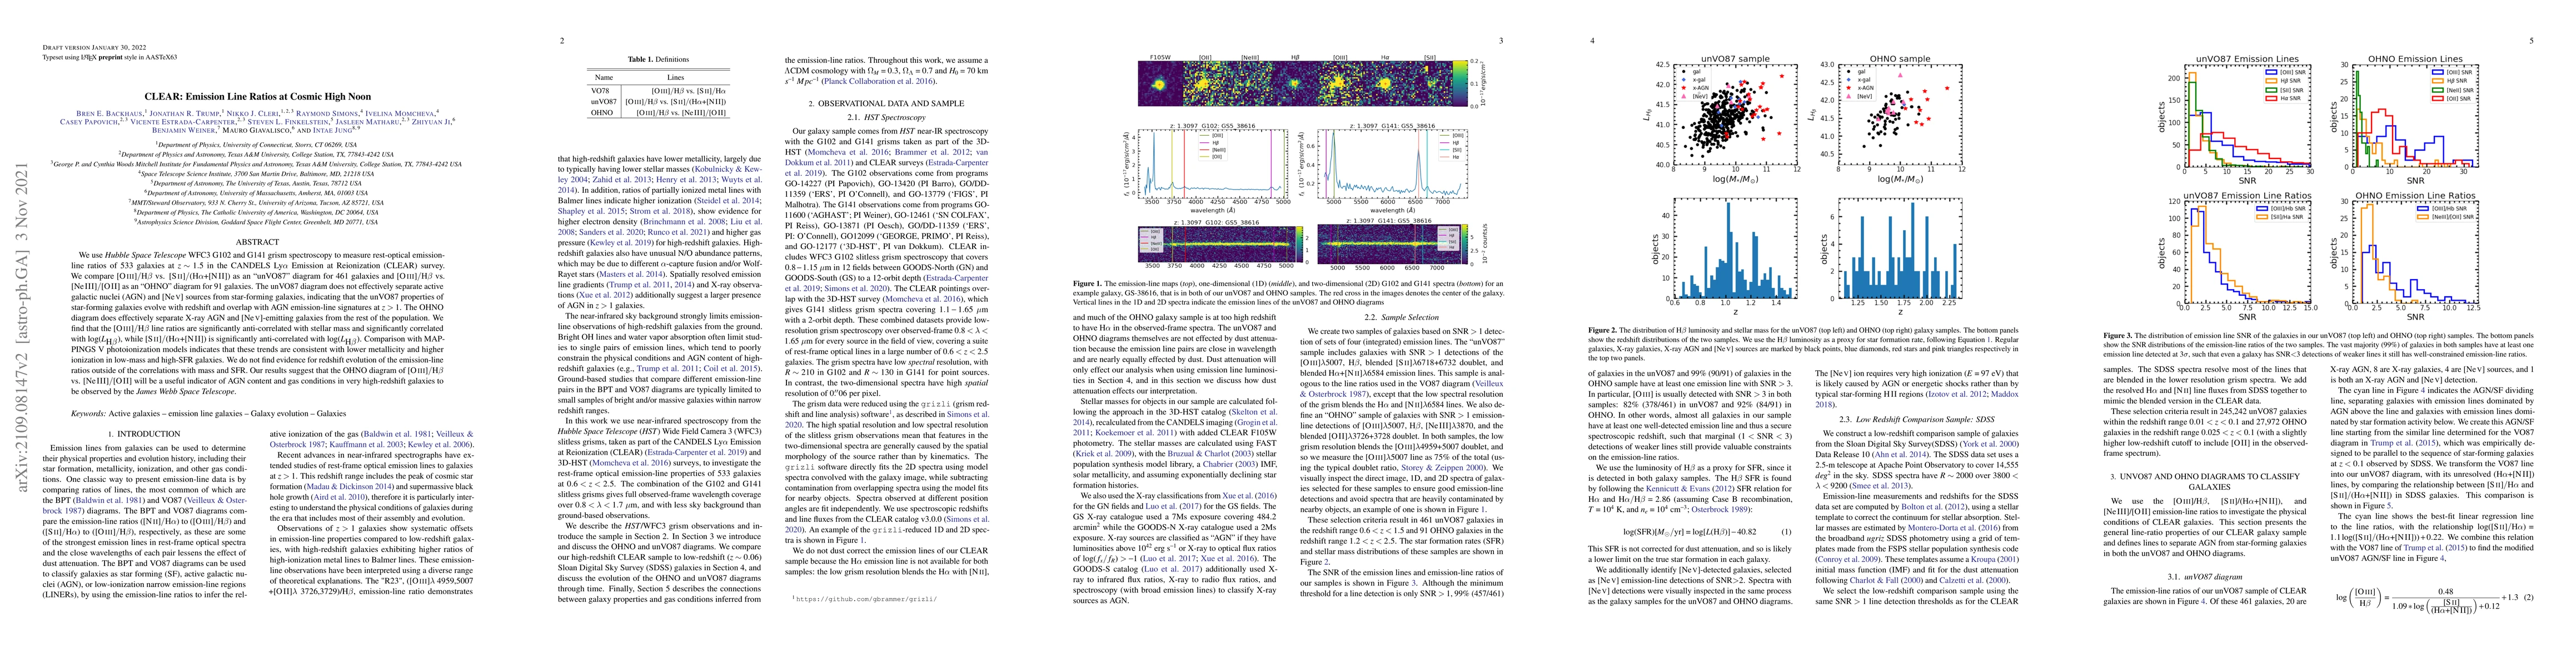
We use Hubble Space Telescope WFC3 G102 and G141 grism spectroscopy to measure rest-optical emission-line ratios of 533 galaxies at $z\sim1.5$ in the CANDELS Ly$\alpha$ Emission at Reionization (CLEAR) survey. We compare $\frac{[OIII]}{H\beta}$ vs. $\frac{[SII]}{(H\alpha +[NII])}$ as an "unVO87" diagram for 461 galaxies and $\frac{[OIII]}{Hb}$ vs. $\frac{[NeIII]}{[OII]}$ as an "OHNO" diagram for 91 galaxies. The unVO87 diagram does not effectively separate active galactic nuclei (AGN) and $[NeV]$ sources from star-forming galaxies, indicating that the unVO87 properties of star-forming galaxies evolve with redshift and overlap with AGN emission-line signatures at $z>1$. The OHNO diagram effectively separates X-ray AGN and $[NeV]$-emitting galaxies from the rest of the population. We find that the $\frac{[OIII]}{H\beta}$ line ratios are significantly anti-correlated with stellar mass and significantly correlated with $\log(L_{H\beta})$, while $\frac{[SII]}{(H\alpha +[NII])}$ is significantly anti-correlated with $\log(L_{H\beta})$. Comparison with MAPPINGS~V photoionization models indicates that these trends are consistent with lower metallicity and higher ionization in low-mass and high-SFR galaxies. We do not find evidence for redshift evolution of the emission-line ratios outside of the correlations with mass and SFR.Our results suggest that the OHNO diagram of $\frac{[OIII]}{Hb}$ vs. $\frac{[NeIII]}{[OII]}$ will be a useful indicator of AGN content and gas conditions in very high-redshift galaxies to be observed by the James Webb Space Telescope.
AI Key Findings
Get AI-generated insights about this paper's methodology, results, significance, and more — seven facets brought into focus.
Impact
Paper Details
Authors
PDF Preview
Key Terms
Citation Network
Current paper (gray), citations (green), references (blue)
Display is limited for performance on very large graphs.
Discussion 0