CloudHeatMap: Heatmap-Based Monitoring for Large-Scale Cloud Systems
Publication
Metrics
AI Quick Summary
CloudHeatMap provides a heatmap-based visualization for real-time monitoring of Large-Scale Cloud Systems, offering intuitive metrics insights to quickly identify performance issues and improve operational monitoring. Demonstrated effectiveness through a case study on IBM Cloud Console.
Paper Preview
Abstract
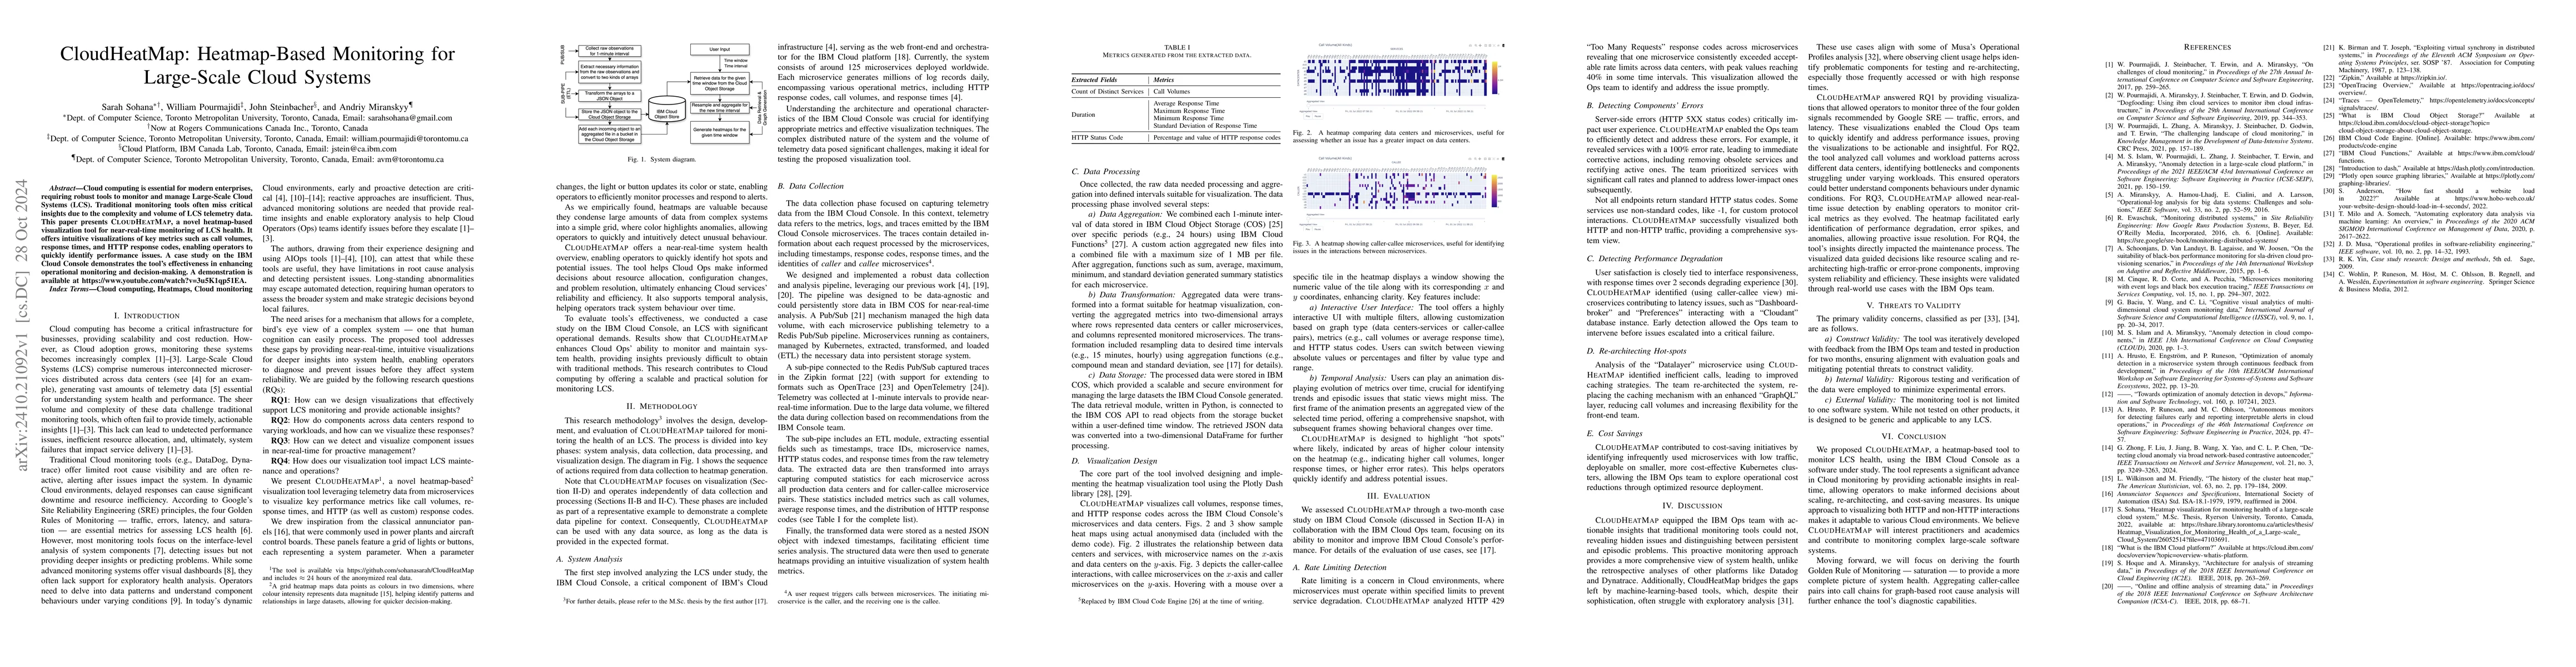
Cloud computing is essential for modern enterprises, requiring robust tools to monitor and manage Large-Scale Cloud Systems (LCS). Traditional monitoring tools often miss critical insights due to the complexity and volume of LCS telemetry data. This paper presents CloudHeatMap, a novel heatmap-based visualization tool for near-real-time monitoring of LCS health. It offers intuitive visualizations of key metrics such as call volumes, response times, and HTTP response codes, enabling operators to quickly identify performance issues. A case study on the IBM Cloud Console demonstrates the tool's effectiveness in enhancing operational monitoring and decision-making. A demonstration is available at https://www.youtube.com/watch?v=3u5K1qp51EA .
AI Key Findings
Get AI-generated insights about this paper's methodology, results, significance, and more — seven facets brought into focus.
Impact
Authors
PDF Preview
Citation Network
Current paper (gray), citations (green), references (blue)
Display is limited for performance on very large graphs.
Discussion 0